Wild market volatility is always fun to look at on the charts.
So let’s have fun with a few.
Here’s a fun chart showing what the commodity rally, recent weakness and Japanese earthquake/tsunami/nuclear meltdowns have done to the Loonie:

That’s the Loonie in terms of the Japanese yen. Yes, as Japan’s economy has gone into seizure and its already perilous financial situation gets more horrifying, its currency has surged in value compared to ours. The recent drop of commodities – partly induced by Japan’s problems – explains some of that, because the Loonie is a commodity currency.
But a lot of it has to do with the Quixotic “flight to quality” that happens when major parts of the world’s economy or financial system are convulsed with problems: people sell all other assets and throw their money into the cash and debt instruments of perceptually-safe currencies. Usually that means the U.S. dollar and the Japanese yen. So in 2008 it didn’t matter that the U.S. economy and financial system were imploding and Canada’s banks and economy were safe, people still fled the Loonie and piled into the Greenback.
That’s part of what’s happening with the yen right now.
Commodities have been getting whacked by the Japanese situation, something that is exacerbating the slide that was already underway before the earthquake.
On short term charts it looks scary. On medium term chart it looks like things could become scary, but there is still longer term trend support for most crops that hasn’t been decisively breached. Yet. But it’s sure getting breachy.
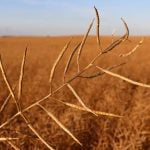
Here’s canola:


Even the one year chart looks pretty scary there, but there’s more hope it can return to the old trendline upwards that it’s not so far beneath. Perhaps soon, older and wiser, it will.
Corn is leading the ag markets, so lets look at that commodity:


Corn doesn’t look as bad on the weekly, 14 month chart, in that it isn’t so far below that long trend upwards and seems maybe to be bouncing off the low-line. But it’s definitely in scary territory.
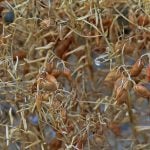
Soybean prices are veg-oils boss. What are they doing:


The recent jolt is taking soybeans below that long trendline, but it’s still in the zone.
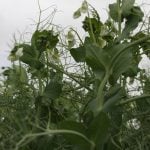
Spring wheat futures:


Same sort of phenomenon there.
For a reading of the overall world view of crop prices, I use the DBA ETF, which combines sugar, corn, soybeans and winter wheat.
Here’s what it’s saying:


I slapped Bollinger bands and a 20 day moving average and a 50 day moving average on that chart. That’s the healthiest looking chart of the bunch, but still it shows crop prices at a crucial point, tickling the crossover point into downwards territory.
So, where does that leave us?
For me, it means lots more time in coming days looking at the charts and figuring out relaxation and panic points. Because this is scary territory, but not yet time to panic necessarily.