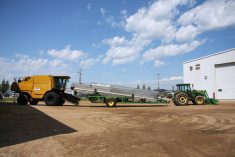
BRANDON – If people recognize the Veris 3100 cart, if they might conclude soil scientists are measuring salinity.
Because the Veris does such a good job of documenting electrical conductivity (EC), which is the main test indicator for salinity, most producers and agrologists assume it’s primarily a salinity instrument.
But people who delve into the mysteries of soil structure have a different take on the Veris. By charting electrical conductivity in a field, they learn a lot about soil structure.
However, it’s difficult to make the connection between a scientific instrument that measures electrical conductivity and information that affects a farm’s bottom line, which is perhaps why only a small number of Veris carts are used on the Prairies.
Read Also
Breaking down successful winter feeding into six steps
It’s that time of year when it is important to start planning for a cow herd’s winter feeding program. Here are six steps I think are necessary to consider when getting your feed tested.
One of them is owned by AgriTrend adviser Marilyn Kot of Francis, Sask.
“Salinity actually wasn’t our main reason for investing in the Veris,” Kot said, as she demonstrated her Veris 3100 at a recent AgriTrend field day at the Spring Valley Colony south of Brandon.
“We bought the Veris because we wanted to look at other soil properties. EC readings give us a very good indication of soil texture down in the root zone. Once you’ve run the field to get EC, you need to ground truth the data.”
Saline soil is a good conductor of electricity so the higher the reading, the more saline it is.
Kot has mounted a core sampler in her truck cab, allowing her to collect and interpret samples the same day. However, if there’s a lot of data, she takes it home for more in-depth analysis. She also looks at yield maps, vegetation maps and data the client may have.
Once she’s studied the background, Kot returns to the field with a strategic plan and GPS points where soil samples should be taken to study why problems are occurring.
Kot said the background research is necessary because two areas with distinctly different soil and different problems can show the same bushel numbers on yield maps and the same crop density on Normalized Difference Vegetation Index (NDVI) maps.
“For example, a high knoll might register the same low productivity as a saline pothole, yet the two areas are totally different – opposite in fact,” she said.
“That’s why I use the yield maps and NDVI as helpful tools only. They can both be deceiving. The Veris shows us the real differences in the soil. When we map different zones based on EC, we know for sure that we’re mapping distinctly different soils.”
Each soil and zone will have typical yield-limiting factors. These are often verified by historical yield maps, aerial photos, satellite photos and other data.
Kot noticed that electrical conductivity readings do not necessarily correspond to field topography. Even when she takes soil samples, it doesn’t follow the expected pattern of lighter soil on the knolls and heavier soil in low areas.
“Sometimes it’s upside down. There are no absolutes,” she said. “The more EC data we gather, the more we learn, but we also run into more and more questions about what’s happening in the soil.”
Kot bought her used Veris 3100 for $10,000 and charges $8 per acre to chart electrical conductivity.
“Once your EC is charted, that map is good virtually forever unless you do some major drainage or deep ripping. Electrical conductivity doesn’t change.”
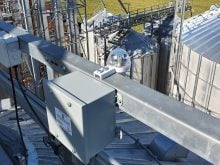
Kot said ground speed limits how many acres she can cover in a day. All coulters must be in firm contact with the soil at all times to make a complete electrical circuit. If ground speed increases and the coulters jump, the circuit breaks and data must be thrown out.
Side slope salinity seeps
Cory Willness of CropPro Consulting, who has charted electrical conductivity on 40,000 acres near Naicam Sask., said his Veris has been running steadily since he bought it in the spring of 2008.
In that short time, he has discovered salinity problems in fields where nobody suspected they existed.
He also identified fields with side slope salinity seeps, a condition he previously thought existed only in textbooks.
“Around here, we’ve found fields with 50 to 100 little pockets of salinity scattered through a half section. There’s no salt crust or any kind of visual indicator at all, but these are areas where crop doesn’t grow,” he said.
“The other surprise was all the side slope salinity seeps. We’ve discovered this on those long sloping fields. The client tells me that for some reason, the crops don’t grow well in the centre of his field. It’s at approximately a mid-point between the knoll and the low point. With the Veris, that’s the place where we get the high EC readings.”
He said he’s been consulting on some of those fields for more than 10 years and would have said there’s no salinity problem. However, the numbers from the Veris don’t lie. They explain long-term mysteries of poor production in certain areas.
Producers typically think the side slopes produce their best crops on a long-term average.
The eroded knolls no longer have the best soil and the low spots often have too much moisture. If there’s any salinity in the fields, that’s where farmers assume it should be.
Willness advises producers to stop trusting their assumptions and get numbers. He said the electrical conductivity numbers generated by the Veris prove side hill salinity is a reality.
“I’m dealing with at least 30 fields that have no salinity down in the depressions. None. All the salinity on these fields is on the side hill, especially if it’s a field with a long slope.
“It’s a classic textbook case. You have the water recharge on the top of a big hill. The water infiltrates into the soil and runs down until it hits an impermeable layer. Then it’s forced to the surface. There doesn’t have to be a pothole anywhere in sight.
“The thing about the Veris is it measures EC down deep. Sometimes the worst salinity isn’t on the surface. Sometimes it’s deep down in the root zone where you can’t see it. You can dig down six inches with your shovel, but that’s not enough to find the salinity.”
In wet years, farmers sometimes complain about the phenomenon of getting stuck in the mud on a side slope where they think it should be dry. They naturally assume all the water should be at the bottom of the slope.
Willness said if producers are getting stuck on a side hill, there’s a good chance they’re in a saline seep. Water moves the salt along as it goes to the surface, so those are prime areas to check for salinity.
Willness said producers have farmed through these saline areas and kept adding fertilizer.
However, adding fertilizer to saline areas is the exact opposite of what should be done.
He said the saline areas are in worse shape today than they were before commercial fertilizers because the nutrient buildup compounds the initial problem found in nature.
“These areas are very high in nitrogen and very high in phosphate, so high that your crops can’t grow.”
Sow heavy
Willness advises his clients to increase seeding rates in these areas because it helps use up excess moisture and nutrients and keep weeds down. They also use variable rate technology to cut off the fertilizer when it’s not needed.
He said nothing but kochia can grow in fields that exceed a certain salinity reference number, but areas with lower salinity can grow an average crop if the client has a good variable rate program.
While salinity is an important issue, and one that can be solved, the Veris also gives Willness a good idea of soil structure in a field.
“When we compare Veris soil structure maps to yield maps and imagery maps, we’re able to figure out what’s happening in each area of a field. That’s very important in our variable rate zoning procedure.”
He equipped his Veris cart with an AutoFarm dual frequency RTK GPS system to chart elevation as he charts electrical conductivity.
CropPro charges a one-time fee of $10 per acre to run the field and create the electrical conductivity and topography maps. The fee includes layering other images and data the client already has. Once the initial field mapping has been completed, CropPro has an annual fee of $3.50 to $4 per acre to soil test and write VRF prescription maps.
“We bought the Veris so we can develop zones as accurately as possible, based on the soil. We don’t have to create new zone maps every year like other people do with imagery based services.”
For more information, contact Marilyn Kot at mkot@agritrend.com or Cory Willness at crop.pro@sasktel.net or visit www.veristech.com.