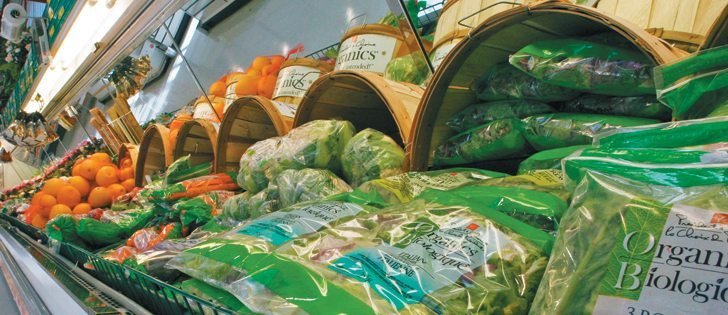
Beef, pork lose market share | Consumers see fish and chicken as healthier choices, Alberta study finds
Gordon Cove was in for a surprise when he reviewed the 2012 Canadian Consumer Retail Meat Study.
Cove, chief executive officer of the Alberta Livestock and Meat Agency, found that certain types of meat continue to lose ground as the protein of choice.
“I guess what surprises me is that trends are still going the way they are and traditional stocks like beef and pork continue to lose market share and fish and chicken are still moving up,” he said.
The agency commissioned the study to measure consumer preferences, attitudes, needs and perceptions toward meat.
Read Also

Sustainable food has ‘lost all meaning’: prof
That marketing strategy is deader than a doornail, says a University of Guelph professor who specializes in consumer preferences and perceptions of agriculture and food.
It provides insight into consumers’ purchasing motives and their approach to purchasing decisions.
It’s intended to help the industry understand consumer psychology when purchasing meat and then use that knowledge to create products that consumers will buy.
Many of the trends that were found in a 2010 study continue to play an important role in the retail environment. These trends are expected to continue five years from now.
The retail meat case is rapidly evolving because of economic pressures, changing population demographics and heightened consumer awareness of food safety and health.
As in the 2010 report, the latest study shows consumers continue to perceive chicken and fish to be the healthier choices.
The report concluded that beef and pork are at a “perceptual deficit” to fish and chicken in nutrition and health.
“When consumers read nutritional labels, they are focused on fat and calories and are not seeing the protein, iron and nutrients or any positive nutrition message,” the report said.
There are also marketing opportunities, particularly with ethnic consumers who will increasingly become important targets as their proportion of the population grows.
Cove was also surprised to see that consumers are paying closer attention to country of origin as well as production claims such as hormone free, antibiotic free, grass fed and organic.
“I think the importance of labelling and getting information out to the consumers was just paramount throughout the whole report. People are looking for it and they’re making decisions on it,” he said.
The study found price remained the biggest driver at 56 percent, followed by country of origin at 30 percent and production claims at 14 percent.
“At the end of the day, having price and the origin of where it came from, that had a great deal of influence over all those other things,” Cove said.
The use of technology such as QR codes to communicate with customers appears to be in its infancy when marketing food. It’s another tool that Cove said the meat industry could use more often.
As well, retailers need to stay aware of changes that may potentially occur rapidly.
“People are looking for more information. There’s just no other way of putting it.”
The skinny on fat
A comparison of beef, chicken and beef cuts per 100 grams of cooked, lean meat
Filet of sole 1.5
Chicken breast 2.1
Tuna, white, drained 3.0
Beef inside round 4.0
Chicken, light meat 4.1
Beef top sirloin 5.6
Rainbow trout, wild 5.8
Beef strip loin 7.0
Chicken thigh 7.0
Beef tenderloin 7.2
Salmon, pink, canned 7.4
Chicken, dark meat 9.7
Beef flank 9.8
Salmon, Atlantic farmed 12.4
Beef rib eye 14.9
Mackerel, Atlantic 17.8
Source: beefinfo.org


