 It appears it was a case of sell the rumour and buy the fact as canola futures rose today following Thursday’s bearish Statistics Canada crop production report.
StatsCan might have increased its canola production estimate by about 1.5 million tonnes from the September report, but the January futures contract today rose $10 per tonne, raising the price to $422.70. It was the best one-day gain since October.
Read Also
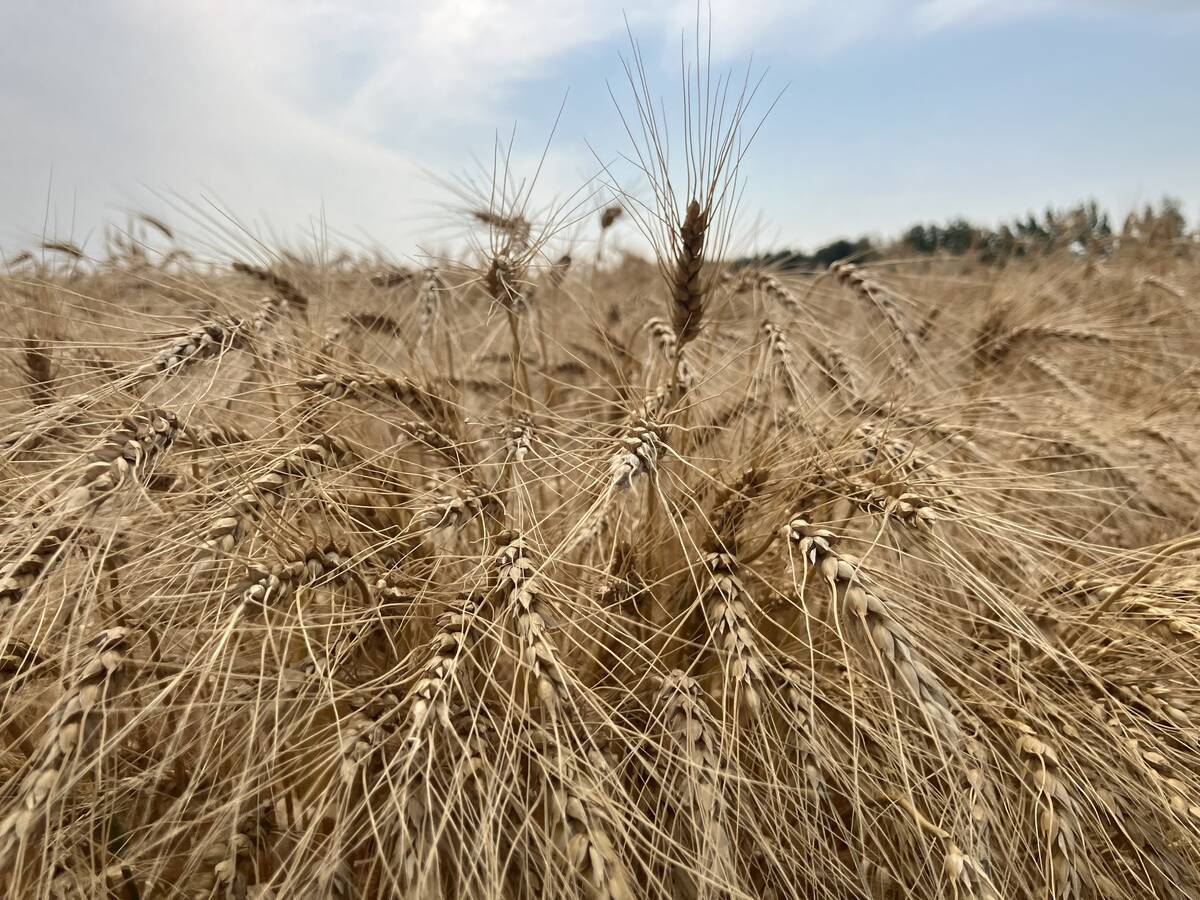
Prairie Wheat Weekly Spring wheat prices decline
Western Canadian spring wheat prices were mostly lower, while those for durum were relatively steady during the week ended Aug. 14, 2025.
Canola got support from the rising soybean complex and a weaker loonie.
Farmers’ reluctance to sell at these prices also supported the market.
The January contract remains at a premium to March, indicating solid demand.
The crush margin has improved. The Canadian Oilseed Processors Association said members crushed 133,379 tonnes of canola in the week ending Dec. 3, an increase of more than seven percent over the week before. That represented a capacity use of about 73 percent.
The strong gains today offset most of the earlier losses and January closed down only $2.60 per tonne or 0.6 percent from last Friday.
Soybeans rose again today, supported by the weekly USDA export sales report from Thursday that showed soybean, soy meal and corn sales were more than expected.
Beans and meal were also supported by talk that China might loosen restrictions on imports of U.S. distillers dried grain. If more DDGs go to China, it could tighten the supply of high protein feed ingredients in the domestic U.S. market, which would support soy meal prices.
DDG sales to China halted in July over a dispute about traces of unapproved GM corn, Syngenta’s MIR 162.
Soybeans gained two percent on the week.
The strong exports and rising soybeans also lifted corn futures today. Over the week, December corn gained 1.5 percent.
Wheat futures were mostly higher today, supported by rising corn. Gains were limited by the slow pace this week of wheat export sales.
Wheat prices ended the week well off the highs set early in the week when values rallied on speculation that Russia might curb exports because of a potentially smaller harvest next year. But by Wednesday the trade had decided that is had gotten carried away on the speculation.
Still Chicago wheat gained 2.7 percent on the week.
Canadian West Coast port price quotes as compiled by Agriculture Canada for the week ending Nov. 28 were as follows:
• West Coast No. 1 CWRS 13.5 percent protein $334.50 per tonne, up from $328.35 the week before.
• West Coast No. 1 durum 13 percent protein $514.49, up from $507.74 the week before.
• St. Lawrence No. 1 durum 12 percent protein $588.01, up from $587.74 the week before.
The USDA releases its monthly supply and demand reports on Dec. 10. Analysts expect the USDA will trim its forecast of U.S. 2014-15 soybean ending stocks and raise its estimates of corn and wheat ending stocks.
Palm oil futures fell sharply early in the week on the weakness in crude oil but climbed back later and closed little changed from the previous week.
A Reuters poll of planters, analysts and traders forecast Malaysian palm stocks hit a 21-month high of 2.29 million tonnes at end-November, as production outstripped export demand. However, analysts expect production will now decline, as will stocks.
Analysts say the impact of drought earlier this year could hurt palm oil supply in top growers Indonesia and Malaysia in 2015, Reuters reported.
Light crude oil nearby futures in New York fell 97 cents to US$65.84 per barrel.
The Canadian dollar at noon was US87.54 cents, down from 87.93 cents the previous trading day. The U.S. dollar at noon was C$1.1423.
Canada lost 10,700 jobs in November and the unemployment rate rose to 6.6 percent. Analysts had expected an increase of 5,000 after the previous two months of strong job gains.
The U.S. economy created 321,000 jobs, more than expected and the most since January 2012. The unemployment rate held steady at a six-year low of 5.8 percent.
In unofficial tallies:
The Toronto Stock Exchange’s S&P/TSX composite index closed up 3.75 points, or 0.03 percent, at 14,473.70.
The Dow Jones industrial average .DJI rose 58.69 points, or 0.33 percent, to 17,958.79, the S&P 500 .SPX gained 3.45 points, or 0.17 percent, to 2,075.37 and the Nasdaq Composite added 11.32 points, or 0.24 percent, to 4,780.76.
For the week, The TSX fell 1.1 percent, the Dow rose 0.7 percent and the S&P rose 0.4 percent. It was the seventh straight weekly gain for both. The Nasdaq slipped 0.2 percent on the week.
ICE Futures Canada, dollars per tonne
Canola Jan 2015 422.70 +10.00 +2.42%
Canola Mar 2015 420.90 +10.00 +2.43%
Canola May 2015 423.30 +10.60 +2.57%
Canola Jul 2015 424.50 +10.70 +2.59%
Canola Nov 2015 422.20 +11.70 +2.85%
Milling Wheat Dec 2014 232.00 +1.00 +0.43%
Milling Wheat Mar 2015 240.00 +2.00 +0.84%
Milling Wheat May 2015 243.00 +2.00 +0.83%
Durum Wheat Dec 2014 356.50 unch 0.00%
Durum Wheat Mar 2015 357.50 unch 0.00%
Durum Wheat May 2015 357.50 unch 0.00%
Barley Dec 2014 174.00 unch 0.00%
Barley Mar 2015 177.00 unch 0.00%
Barley May 2015 179.00 unch 0.00%
American crop prices in cents US/bushel, soybean meal in $US/short ton, soy oil in cents US/pound
Chicago
Soybeans Jan 2015 1036 +25.5 +2.52%
Soybeans Mar 2015 1042 +24.75 +2.43%
Soybeans May 2015 1048.25 +24.5 +2.39%
Soybeans Jul 2015 1053.5 +24.75 +2.41%
Soybeans Aug 2015 1052.25 +24.25 +2.36%
Soybeans Sep 2015 1031 +24 +2.38%
Soybean Meal Dec 2014 394.2 +8.5 +2.20%
Soybean Meal Jan 2015 366.4 +8.6 +2.40%
Soybean Meal Mar 2015 354.2 +9.3 +2.70%
Soybean Oil Dec 2014 32.01 +0.41 +1.30%
Soybean Oil Jan 2015 32.08 +0.38 +1.20%
Soybean Oil Mar 2015 32.3 +0.39 +1.22%
Corn Dec 2014 381.5 +5.5 +1.46%
Corn Mar 2015 395 +5.25 +1.35%
Corn May 2015 403.5 +5.25 +1.32%
Corn Jul 2015 410 +5.25 +1.30%
Corn Sep 2015 414 +5 +1.22%
Oats Dec 2014 299.5 +0.75 +0.25%
Oats Mar 2015 312.75 +0.75 +0.24%
Oats May 2015 312 +0.5 +0.16%
Oats Jul 2015 311.25 +1 +0.32%
Oats Sep 2015 309.75 +0.75 +0.24%
Wheat Dec 2014 609 +9.25 +1.54%
Wheat Mar 2015 594 +4.25 +0.72%
Wheat May 2015 599 +4 +0.67%
Wheat Jul 2015 602.25 +3.5 +0.58%
Wheat Sep 2015 610 +4 +0.66%
Minneapolis
Spring Wheat Dec 2014 619.5 -3.75 -0.60%
Spring Wheat Mar 2015 623 +4.5 +0.73%
Spring Wheat May 2015 629.75 +4.25 +0.68%
Spring Wheat Jul 2015 637 +3.75 +0.59%
Spring Wheat Sep 2015 645.25 +4.5 +0.70%
Kansas City
Hard Red Wheat Dec 2014 632.5 +5.25 +0.84%
Hard Red Wheat Mar 2015 639.25 +3.75 +0.59%
Hard Red Wheat May 2015 643.25 +4.5 +0.70%
Hard Red Wheat Jul 2015 643.25 +3.5 +0.55%
Hard Red Wheat Sep 2015 652.75 +3.5 +0.54%