Farmers who look on the internet for an easy solution to the question, which is better, solar or wind generation, will not find it.
Natural Resources Canada has a good solar potential map with bright colours and useful measurements. It’s considered to be a good source of solar information.
Unfortunately, there’s no comparable map for wind potential.
Canadian Geographic has a pastel coloured wind map but no numbers to quantify potential.
The sliding scale that runs from lowest to highest is useful, but only for determining if you’re in an adequate area for wind generation.
Read Also
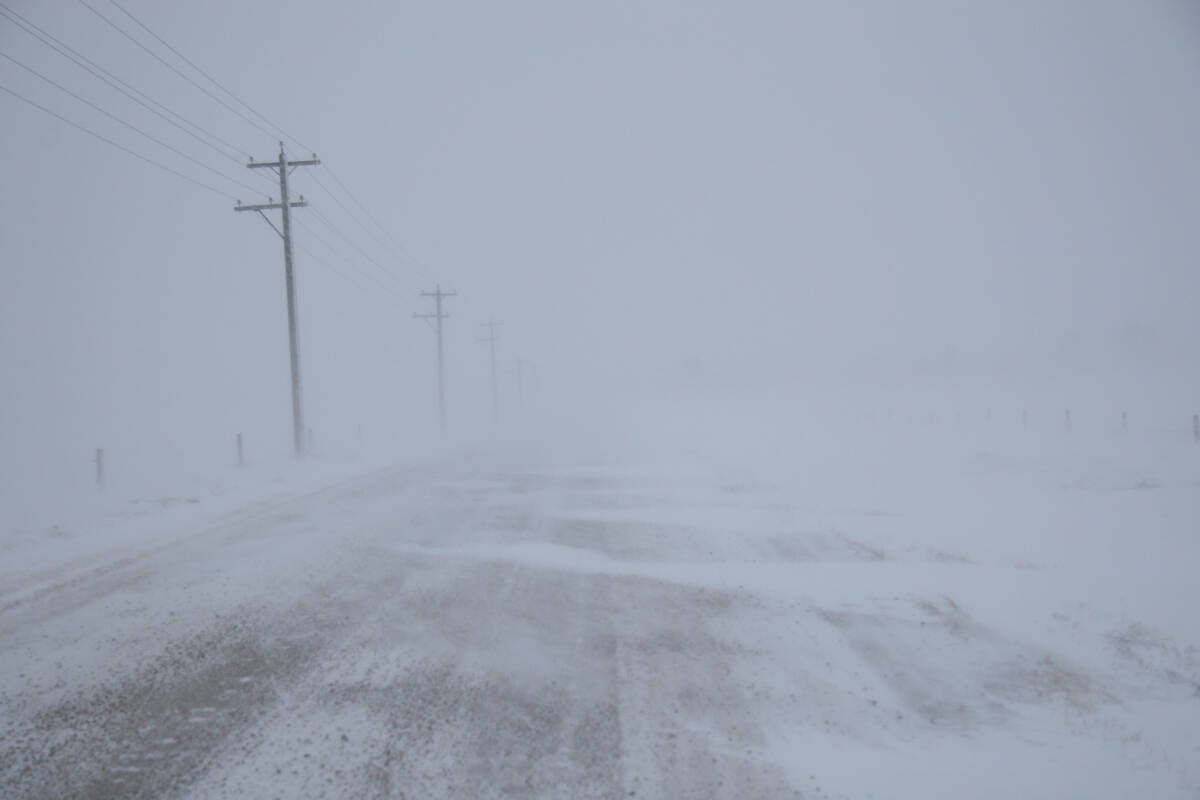
Volatile temperatures expected for this winter
DTN is forecasting a lot of temperature variability in the Canadian Prairies this winter. Precipitation should be close to average.
The colourful wind map produced by Environment Canada would have been helpful if it had used the same units of measurement as did the Natural Resources solar map.
There are basic problems when using any map that compares solar to wind in a particular region.
For one thing, wind data must be gathered at the same height at which the turbine will eventually be installed.
The return on investment will be wrong if data is collected from a lightweight anemometer mounted on a 100 foot tower but the plan is to install the heavier turbine on a 70 foot tower.
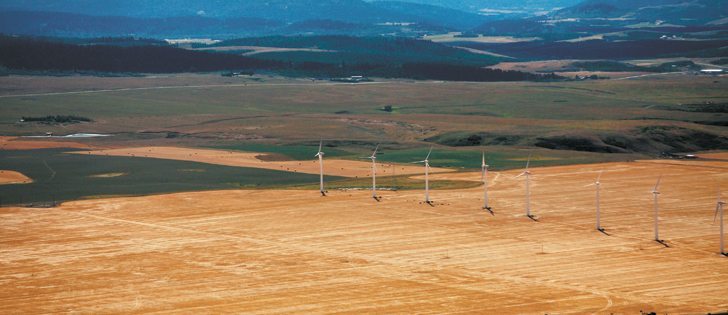
As well, the area with the best wind potential may be only a few square miles or even just a few acres, but that optimal spot may not be convenient for the farmer.
Eric Bibeau, renewable energy professor at the University of Manitoba, said it’s easier to conduct map analysis when locating solar sites because good solar areas shown on the maps are large. However, wind potential is geo-centric, which is why wind maps are vague and on-site analysis must be stringent.
“The optimum site might be the size of a small town,” said Bibeau.
He said the data that farmers need to make rough solar-wind comparisons exist, but it’s not publicly accessible.
“At what point is solar and wind going to tip? What’s the grid parity in Manitoba, Saskatchewan and Alberta? You won’t find it because the utilities calculate it and they keep it to themselves.”
Bibeau said farmers who are trying to decide which resource to tap should keep in mind that prices for equipment to harvest solar and wind are in flux. Most notable is the dramatic increase last spring in the price of solar panels after years of downward price movement.
“We went through a huge price decrease in solar panels, and then our good folks in the federal government decided to put an embargo on Chinese panels. They (Chinese) make 70 percent of the panels worldwide, he said.
“There are four companies (making solar panels) in Ontario that are subsidized by the Ontario government. And they get subsidized by the federal government.
“They got caught by the Germans and the Danish for not following the trade agreements. They (Germans and Danes) retaliated. And then Ontario basically said, ‘now all you guys in the Prairies pay for the fact that we got caught subsidizing. And now you will pay more for your solar panels.’ ”
Bibeau was blunt when asked why the federal government would pay lip service to renewable energy and then impose high tariffs on low cost Pacific Rim solar panels.
“Being big on renewables and actually doing it are two different things. All you need to do is be in front of a parade and say you’re big on renewables.”
Does solar win?
Energy Matters of Australia sells solar and wind generation equipment. It says solar is best for most residential and rural sites, for the following reasons:
- no moving parts
- better reliability and generally longer warranty
- requires less monitoring
- more predictable energy output
- better value on sites with average wind speeds less than five metres per second
- totally silent
- quicker installation with less cable required
- less susceptible to lightning damage
- less susceptible to wind damage
- requires less space because panels can be installed on a roof
For more information, contact Bibeau at eric.bibeau@umanitoba.ca.