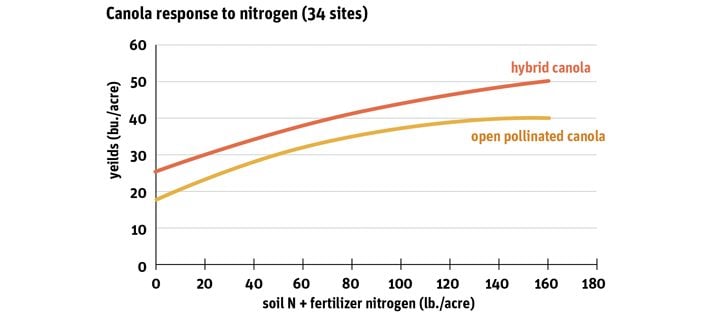
Nearly every producer has seen the graph.
The bottom of the graph has the rate of applied nitrogen, ranging from zero to 200 pounds per acre. On the side is the canola yield, ranging from zero to 70 bushels per acre.
The curve on the graph illustrates how yield increases as the rate of nitrogen rises, but the canola yield eventually plateaus.
Brian Arnall, an Oklahoma State University soil scientist, has seen hundreds of such graphs, for many crops, but he doesn’t take them seriously.
Read Also

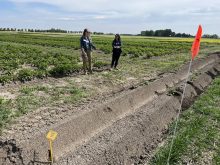
Farming Smarter receives financial boost from Alberta government for potato research
Farming Smarter near Lethbridge got a boost to its research equipment, thanks to the Alberta government’s increase in funding for research associations.
“We’ve moved to a field level. We’re in a zone level now…. We are at a sub metre level on some of our (inputs). But we get into our nutrient management tools and we’re using recommendations built not for a zone, not for a field, not for a farm, but for a state,” said Arnall, who spoke at the Canola Discovery Forum, a Canola Council of Canada agronomy conference held October in Winnipeg.
“We’re using a massively coarse knob to make adjustments for a little, bitty area. And it doesn’t work.”
Arnall, who specializes in precision nutrient management, said it’s time to move away from broad geographical recommendations for fertilizer. Instead, farmers should rely on results and data from their own farms.
“This field, this area, in this quarter section, operates in this way,” he said. “Why are we not determining each field’s needs? N,P, K, S. All of it.”
Advocates of precision agriculture would likely agree with Arnall. More Canadian producers now rely on zone maps and other data to manage crop inputs.
“If you think about the soil type varying within a field and that soil type having an impact on what your canola, or whatever crop will yield, then managing your zones based on the soils in your field makes a lot of sense,” said Marla Riekman, Manitoba Agriculture land management specialist.
If soil type and yield response varies within a field, how are nitrogen recommendations for an entire province still relevant?
Riekman said such guidelines are based on plot data from dozens of locations across a province or throughout Western Canada.
The aggregate result and yield curve is representative of all those soil types.
“All of those plots are done in such small areas,” Riekman said. “So they’re not going to have variability within that plot. They’ll have variability … from plot to plot because the soil is different.”
Regardless, Arnall said farmers must understand what’s happening at a smaller scale, on their fields or within their fields.
He added producers should develop a profitability map with financial returns from different zones of their cropland.
“You know what the majority of fields will show? Anywhere be-tween three and 12 percent of the field loses money every single year,” he said. “What do you do with 10 percent of the field that loses money every single year? Stop putting money into it.”