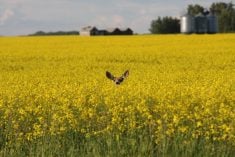
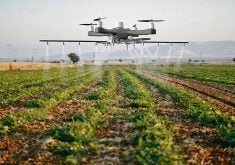
Researchers are increasingly augmenting the time-honoured practice of walking the fields to check for pest and disease pressure, germination or performance with eyes in the sky such as orbital satellites, drone-mounted cameras and combinations of both.
For example, free online tools such as the SKSIS Mapper developed through the University of Saskatchewan’s soil science department offers soil characteristics for agronomists to inform their advice to farmers.
Other stories in the 2023 Canola Yearbook:
- Decent yields in dry times
- Canola views – photo essay
- Canola growing season in review
- Spraying in dry times can be tricky
- Hormone imbalance suspected for malformed racemes
- Incorporating resistant traits weighs on yields
- Production briefs
- Pest roundup: Canola pests kept in check by dry conditions
- Disease roundup: Verticillium has breakout year
- Canola news briefs
- Canola growers scramble to address federal policy issues
- What happens when the big crop comes?
- Bids tumble but canola demand is firm
Another tool is the Aphanomyces Risk Evaluation App (AREA), which allows producers to gauge the risk of the disease in lentil and other pulse crops. Developed by agronomy and remote sensing researcher Steve Shirtliffe at the U of S’s College of Agriculture and Bioresources, AREA is particularly useful for farmers unsure of the history of land they may have just purchased or are renting.
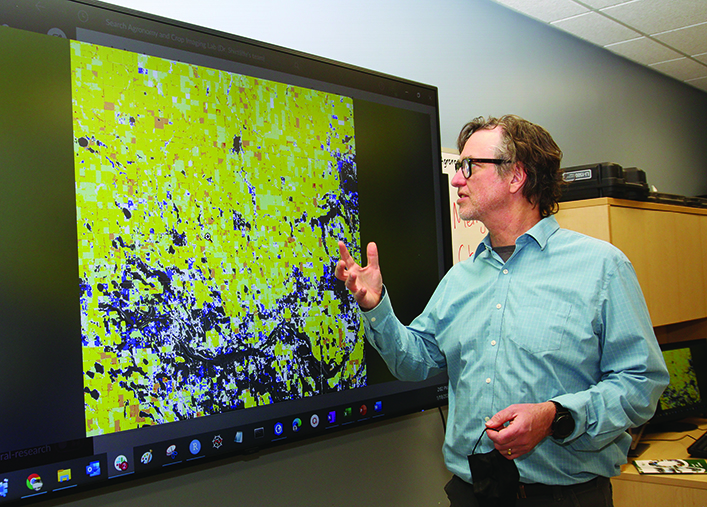
Shirtliffe and his research group are also turning their attention to canola, starting with germination.
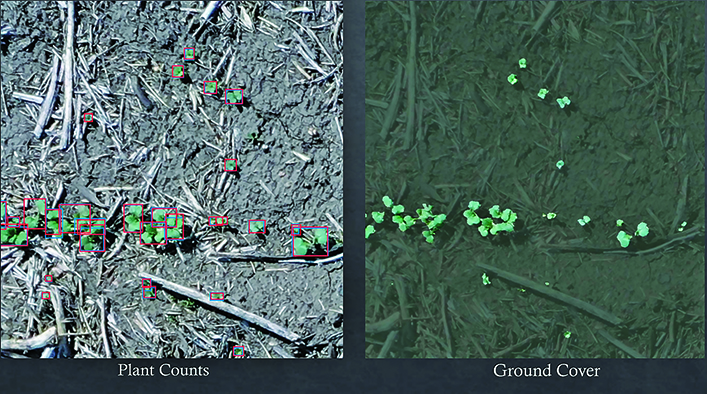
Graduate student Kaylee Krys from Shirtliffe’s agronomic crop imagery lab teamed up with Erik Andvaag from the university’s computer science department to see if drones could be used to count canola emergence. The idea was to see if it could be an alternative to throwing hoops onto the ground, manually counting seedlings and then extrapolating to the field.
Flying the test fields with a drone was pretty straightforward — Krys used a commercial model worth a couple thousand dollars that any farmer might easily purchase. The challenge was to distinguish canola seedlings from everything else in the images.
Shirtliffe said Andvaag developed the computer programs to do just that, using a type of machine learning called convolutional neural networks. Once the program had enough images of canola seedlings in its knowledge base, it could accurately identify them in field images. The added advantage was the ability to sample much larger areas than the hoop-and-count method.
“It identifies canola and then counts it, and you get a lot of other cool metrics,” Shirtliffe said.
“It gives you your density. It also gives you how even the stand is and that sort of thing, and it can distinguish canola from weeds actually quite accurately.”
While the project worked well, he said this was essentially a proof-of-concept study, and work needs to be done before a turnkey solution could be developed for agrologists and farmers. The team would like to explore other capabilities, such as the ability to identify specific weeds and their number. This would help a farmer decide if the infestation had reached the economic threshold to spray.
As for insect infestations, particularly the notorious flea beetle, Shirtliffe said there is potential to develop these systems to distinguish between the distinctive heart-shaped cotyledons of newly emerged canola and beetle-gnawed ones.
“You’re going from a symmetrical heart-shaped cotyledon or whatever you want to call it, kidney-shaped cotyledon, to something that’s had bites taken out of it or little holes taken out of it,” he said.
Because there are no algorithms to do this job, it would fall to researchers to manually and laboriously draw boxes around and label damaged leaves until there were enough in the computer model’s image bank for machine learning to take over.
“I would just suspect that you could do it, but what you do need for something like that is to have the images to train for it,” Shirtliffe said.
While farmers might be reluctant to predict how well a given canola crop did until it’s been shipped and the cheque has cleared, Hansanee Fernando, another graduate student in Shirtliffe’s group, is working on a way to improve yield estimates, at least for smaller test plots.
Hand-counting is a tedious and labour-intensive process, but a drone can easily fly over and get high-resolution images — in the case of Fernando’s work, down to about one millimetre.
“The resolution is better than flower petal dimensions,” she said.
“Hence, if you use a UAV-based sensor with high resolution, it is as good as counting them by hand.”
A caveat is that the drone camera can’t see flowers that are hidden in the canopy by leaves or other flowers. At the same time, the method is pretty straightforward.
“If you know how to calculate vegetative indices using freely available GIS software, this is quick to implement,” she said.
The method proved useful, showing that varieties that flowered intensely for a long time tended to have higher yields.
One drawback is that the high-resolution images are huge and require a lot of computer processing power. Fernando said they kept crashing the initial system the researchers were using, and they had to move to a more powerful machine.
Fernando said this system is more suited to plot-scale studies because of limitations with drones.
“UAVs can map only so much ground cover; it is not practical to fly a quarter section field with a normal UAV,” she said.
“But if a farmer is to use a fixed wing drone, they might be able to use these methods.”
That said, Fernando has uncovered insights with the small-scale approach that she hopes may allow her to map canola characteristics on a regional scale.
Shirtliffe said the team took Fernando’s approach to the field level, using imagery from the Planet constellation of satellites that provide near-daily updates, notwithstanding cloud cover. They also collaborated with Cory Willness of CropPro Consulting.
“He talked to some producers and they provided their yield data and we able to look at a machine learning model that trained on some of those fields and validated on others,” Shirtliffe said.
The researchers determined that flowering time and intensity did indeed explain a lot of the differences in yield. This may come as little surprise to farmers, but it does provide solid numbers to back up their observations and experience.
“From a farmer point of view, it’s just the old observation that the years that canola does really well or places in a field canola does really well are the ones where it flowers a lot for a long time,” Shirtliffe said.
Contact michael.robin@producer.com