Analysts say crops look decent for the most part across the Canadian Prairies as of early July.
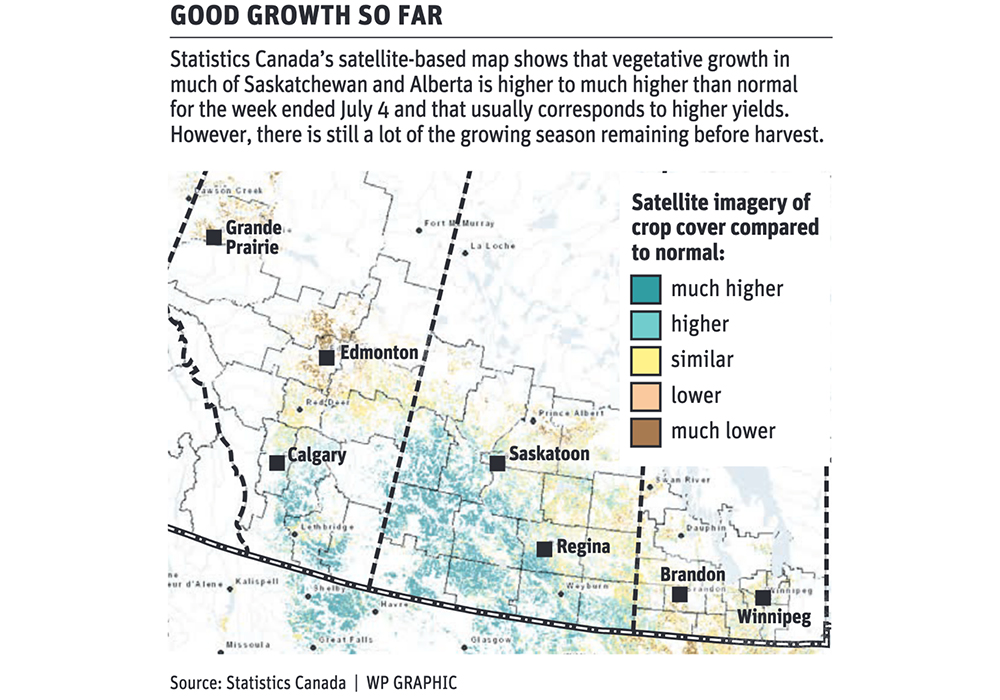
Satellite maps of vegetative growth show conditions in about half of the region are better than normal.
The Normalized Difference Vegetation Index (NDVI) is higher to much higher than normal across southern and western Saskatchewan and southern Alberta, according to Statistics Canada’s Crop Condition Assessment Program.
“It’s reassuring to see how much of the Prairies is actually above normal,” said Gordon Reichert, senior scientific adviser for Statistics Canada’s Remote Sensing and Geospatial Analysis Section.
Read Also
Europe holds promise for Canadian lentils
Pulse Canada is trying to help boost lentil consumption in Europe, which is already the fourth largest market.
Most of the other regions of the prairies were similar to normal as of the week ending July 4.
The only two exceptions are an area surrounding Edmonton and another up in the Peace River region of Alberta, where growth is lower to much lower than normal.
Reichert said good NDVI levels usually correspond to better-than-usual yields.
MarketsFarm analyst Bruce Burnett agrees with Statistics Canada’s midway assessment of the 2020 crop.
“We’re looking at very good conditions for this time of year,” he said.
Any time you have no major area of drought, that is a good thing. However, there are some mounting concerns surrounding excess moisture.
While some crops thrive in wet conditions, he worries about the pea and lentil crops in Saskatchewan and Alberta where there are disease concerns.
Northern Alberta is one definite problem area. Some crops have been lost to flooding and there is significant disease potential for all crops in that area of the province.
Burnett is also worried about the pace of crop development in the eastern Prairies due to cool temperatures. Farmers are still haunted by the long, drawn out 2019 harvest that saw many crops combined in the spring of 2020.
But overall, conditions are looking pretty favourable across the Prairies with the usual caveat that crops are still a long way from being in the bin, he said.
One useful feature of the NDVI maps is that the current season can be compared to previous years such as 2013, a year that farmers produced a record 98 million tonnes of principal field crops.
When Reichert compares the 2020 NDVI map to that record year, he sees similar vegetative growth for western Saskatchewan and southern Alberta, which is very encouraging.
It should be noted that the NDVI values in much of central and eastern Saskatchewan and western Manitoba are lower than those of 2013 and in the Edmonton and Peace River areas they are much lower.
The areas of the Prairies where the NDVI levels look the best correspond with the regions that have experienced the most rainfall during the growing season, according to Agriculture Canada’s agroclimate maps.
The oddities are the Edmonton and Peace regions of Alberta that have received too much moisture.
Reichert said his big concern is that temperatures will get too hot during critical phases of crop development and spoil a good crop.
Burnett said that might be a valid concern for central and eastern Manitoba where it has already been very hot, but much of the western prairie region needs the heat.
He believes farmers would sacrifice some yield for quicker crop development given last year’s harvest nightmare.
Reichert said the data derived from Statistics Canada’s Crop Condition Assessment Program has been used to replace producer yield estimates from the old September field crop survey since 2016.
This year it will also be used to replace the July survey due to work limitations caused by COVID-19.
“We’ll see how it works out,” said Reichert. “I’m very confident in the technology.”
He encouraged farmers to visit the Crop Condition Assessment Program website.
With some basic manipulation of the variables farmers can retrieve NDVI data on a township basis where their fields are located and compare that data to other years.