Statistics Canada has made its first foray into model-based crop production estimates.
On Sept. 17, it released its first official production forecast using the new approach. The forecast contained significant revisions to the canola and wheat production estimates from the July survey of farmers.
“We’re the first or one of the first countries using modeling for crop estimates, and we’re pretty proud of this accomplishment,” said Frederic Bedard, senior analyst with Statistics Canada.
The mathematical model makes adjustments to the July estimate based on comparing this year’s satellite imagery and climatic conditions to the past 30 years of data.
Read Also
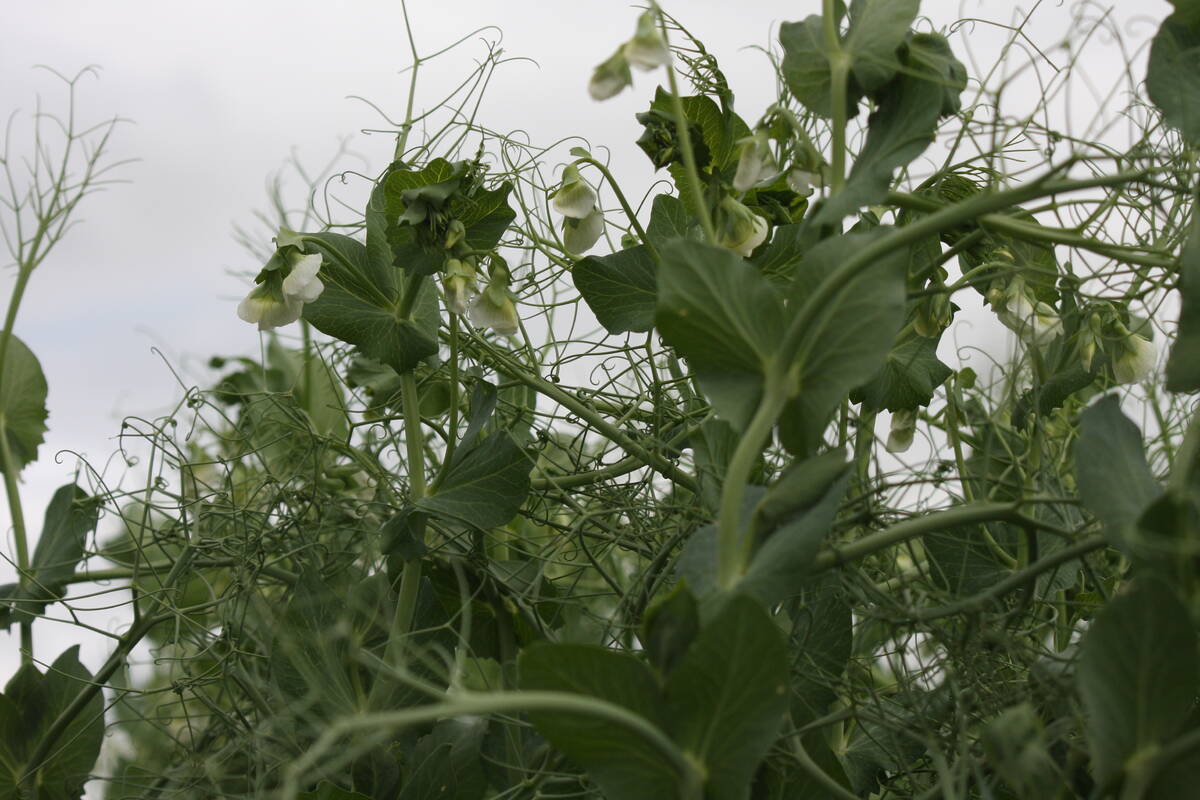
High pea yields shock farmers
There is going to be a massive pea carryout at the end of this crop year.
The satellite imagery is a measure of vegetative growth based on one kilometre resolution data from the U.S. National Oceanographic and Atmospheric Administration’s satellites.
Climatic conditions include precipitation, growing degree days and the crop stress index between May 1 and Aug. 31.
This year’s model suggests there will be an extra 1.1 million tonnes of canola and 429,300 tonnes of spring wheat than farmers told Statistics Canada in the July phone survey.
Bedard said weather conditions improved in Saskatchewan and Alberta during the last half of summer.
The new estimates will be compared to the September and November survey results to test the accuracy of the modeled approach.
If things go well, the model-based estimate will permanently replace the September survey starting next year.
Bedard said statisticians have been testing various models behind the scenes for a few years and have determined this is the best option. It has an average deviation of five percent from the November yield survey.
“We feel it’s good,” he said.
“This year we were confident enough to be able to officially publish our results after all this testing.”
The original plan was to move to a model-based estimate last year, but the model was not accurate enough and needed to be tweaked.
One of those tweaks was incorporating the July survey results into the model rather than solely relying on satellite, climate and historical yield data.
“Adding it was improving our results, so we decided to keep it,” said Bedard.
The change was implemented partly to meet Statistics Canada’s internal objective of reducing the amount of surveying of Canadians.
“The less contact we get with farmers makes everyone happier,” he said.
Getting rid of the September survey also eliminates the costs associated with phoning more than 9,000 farmers and processing the data that comes from those conversations.
It is hoped that the model-based estimates will help grain handlers and transportation providers get an earlier bead on crop size.
The results were released Sept. 17, two weeks ahead of the scheduled Oct. 2 release of the farmer survey production estimates.
Bedard said Statistics Canada must adhere to certain publishing rules.
There needs to be a minimum of 12 years of historical data for a crop and there has to be an acceptable quotient of variation, which is a statistical measure of the quality of the estimate.
The agency has determined that 15 of the 20 crop types meet those requirements. Chickpeas, white beans, coloured beans, fodder corn and sunflowers will not be included in the modeled approach.