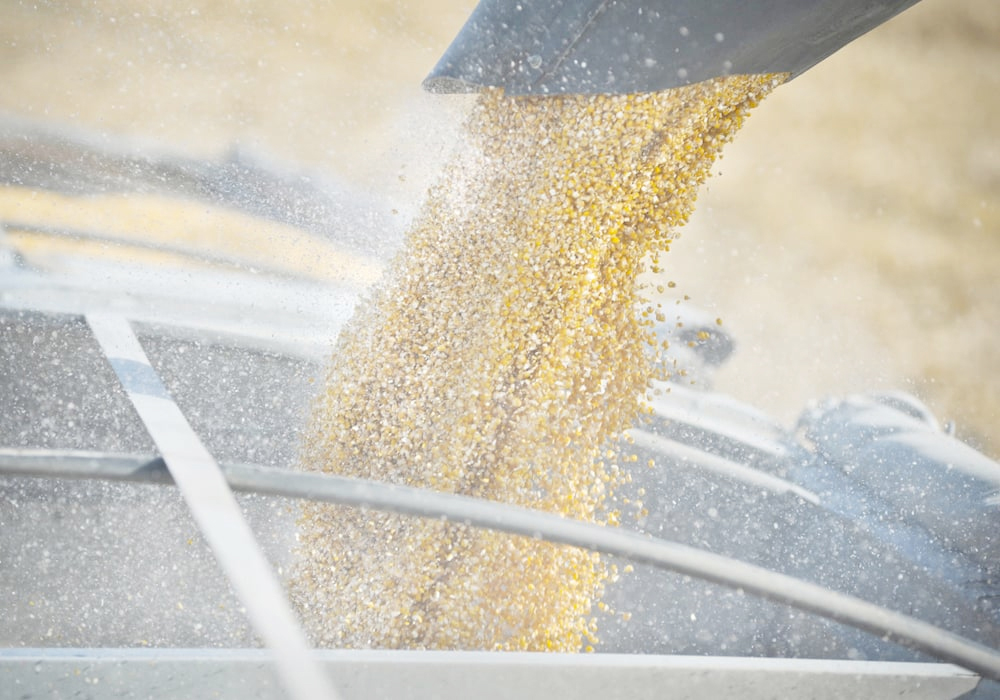
Grain glut,” “ample supply,” “supply pressure”: these phrases are showing up in market reports to describe crop supplies, particularly corn stocks.
Corn is important for the whole grain complex because it tends to set the tone for the market.
On Feb. 23 Chicago corn futures fell below US$4 a bushel for the first time since November 2020.
Two years ago there was much hand ringing about world corn supply as Russia tried to block Ukraine exports, but now the market looks like it is going to deliver prices that were common in the 2015-20 period.
Read Also

Short rapeseed crop may put China in a bind
Industry thinks China’s rapeseed crop is way smaller than the official government estimate. The country’s canola imports will also be down, so there will be a lot of unmet demand.
That was when corn ranged from $3-$4 a bu., breaking above that for only short periods of time.
With production costs 25 to 30 percent more than in the 2015-20 period, it would be hard to survive on $4 corn.
Is the perception of a “grain glut” accurate?
One way to measure it is to look at the amount of grain left over at the end of the crop year and compare it to a full year of use.
This is the stocks-to-use ratio.
The following are the U.S. Department of Agriculture forecasts. Be aware that while the U.S. domestic numbers reflect crops harvested last fall and so have a high degree of accuracy, the world forecasts include South American crops that are now being harvested in the case of soybeans and that are only being seeded in the case of Brazil’s corn.
Brazilian analysts have smaller soy and corn production forecasts than the current USDA figures, and that could affect the world stocks-to-use figures in the months to come.
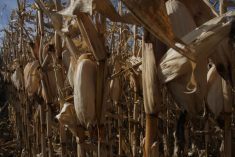
For corn the U.S. stocks-to-use ratio for the current 2023-24 crop year is forecast at 14.9 percent. That is up from 9.9 percent at the end of 2022-23 and 9.2 percent the year before that.
When corn stocks fall below 10 percent of use, that is considered tight and a strong support to prices.
When stocks rise above 14 percent, as they were in 2016-19, that is considered comfortable and it weighs down prices.
It doesn’t help that the USDA’s annual outlook conference in February forecast that the United States would harvest a record corn yield to produce another crop larger than 15 billion bu. and that 2024-25 stocks-to-use would balloon to 17.2 percent.
The USDA outlook conference forecasts are based on “average” weather and “trend’ yields. Mother Nature has a mind of her own and so such forecasts should be viewed for what they are — early educated guesses — but nevertheless the numbers get worked into the conversation.
When we turn to global stocks-to-use, the USDA forecast for the current year is 26.6 percent. That is not as burdensome at it was in the 2015-20 period when it was usually more than 28 percent.
However, the ratio is a little higher than it was in the last three years.
We should also consider the world stock situation with China excluded. China holds by far the largest stockpile of corn, and the supply is not available to the rest of the world, so it clouds the view of global supply.
With China out of the picture, the global corn stocks-to-use at the end of this year is 12 percent, up from close to 11 percent the previous two years and 10 percent three years ago.
So even by this measure, supply is a little more comfortable than in recent experience.
The “glut” perception is less clear with other major crops.
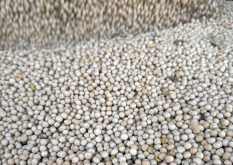
U.S. soybean stocks-to-use at the end of the current year is forecast at 7.6 percent, up from 6.1 percent in the previous two years, but a far cry from levels of more than 10 percent in 2017, 2018 and 2019.
However, global stocks-to-use is at 30.3 percent, which is similar to the high levels in the second half of the last decade.
U.S. all-wheat stocks at 35.2 percent are up from 30.4 percent last year, but are much lower than in 2015-20 when they were 50 percent or more.
Global wheat stocks at 32.5 percent are the lowest since 2015, but that is still fairly comfortable. The stocks level in wheat that seems to trigger concern is less than 30 percent.
Canada’s canola stocks-to-use ratio is expected to climb to 11 percent. It is rare for the canola ratio to be more than 10 percent.
This market fixation on stocks will likely continue for a while.
What could change it? Maybe the market and the USDA are wearing rose coloured glasses regarding Brazil’s crops, which could prove smaller than current USDA estimates.
Also, a warm spring is expected in North America, and that could mean early seeding but also concerns about soil drying out.