Forecasting the size of a crop while it is growing is difficult.
The trade expects a bumper crop this year. Farm groups are warning the railways to prepare.
Of course it won’t be a bumper one on every farm.
Those with excess rain and heavy disease pressure are likely frustrated by the talk of strong prairie-wide production potential. We all realize that it is many weeks yet before the crop is safely in the bin.
In many areas, crops look lush and satellite vegetation monitoring takes a similar view, but we also recognize that disease and other problems could lurk below the crop canopy.
Read Also
Canola used in only quarter of Canadian biofuel
Less than one-quarter of the biodiesel and renewable diesel used in Canada in 2024 was made from canola oil feedstock
The first official Statistics Canada forecast of crop production based on a farmer survey, the July Production of Principal Field Crop Survey, does not come out until Aug. 23.
The trend following the report is that analysts almost instantly dismiss it as being out of date. The market grudgingly admits “it is what it is,” that is, the best official estimate until the next one comes along.
Some farmers with a conspiracy theory bent have the impression that government departments such as Statistics Canada and the U.S. Department of Agriculture routinely over estimate crop size in order to drive down the market in pursuit of a “cheap food policy.”
But a review of the past five years shows a tendency for Statistics Canada’s July survey to underestimate crop size.
In four of the past five years, the final crop assessments were larger than the July forecast.
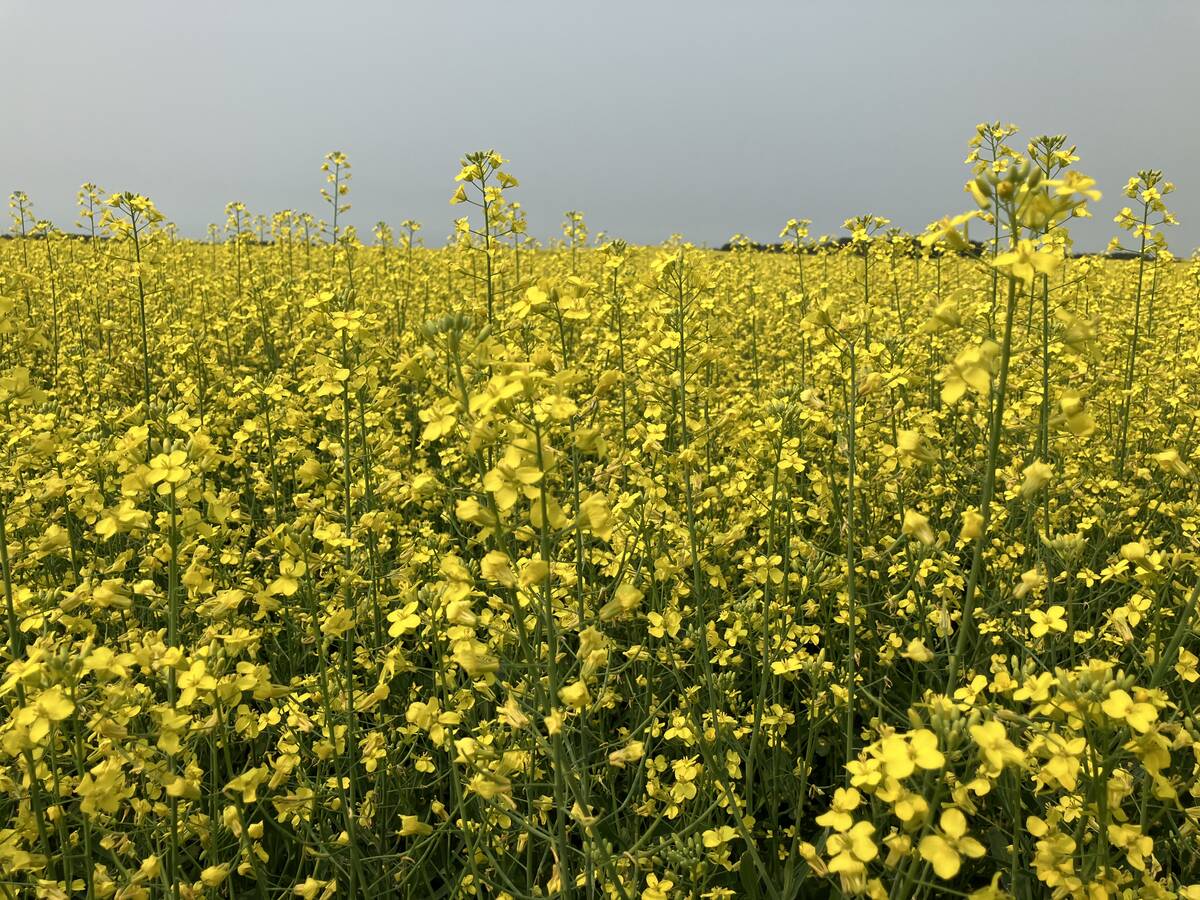
Only in 2012 was the July report too optimistic. That year, heat, disease and strong winds when the crop was in swath caused big damage, particularly to canola.
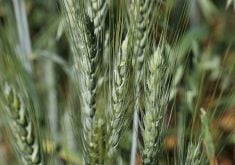
Canola fell to 13.2 million tonnes, about two million less than the July forecast. But even under those trying circumstances, the final all wheat production number crept slightly higher from the July forecast.
In the other years, the final all wheat production number was significantly larger than in July, ranging from 4.3 percent larger in 2011 to 22.7 percent larger in the bumper crop of 2013.
The differences in canola were even larger, ranging from a 10.6 percent increase in 2011 to a whopping 29 percent in 2015.
I should note that I am comparing the July number to the adjusted final tallies.
The November crop production survey, released in December, is known as the final report of the year but it is not the last word on production.
Statistics Canada keeps track of crop disappearance through exports and domestic use and also issues stocks reports.
It analyzes these numbers and sometimes concludes that its November production report under represented the true size of the previous year’s crop.
The Canadian Prairies are going through a wet phase and that has been helping production in the past five years. Also, the latest crop genetics are generally proving that they can handle a range of weather stresses. These factors can generate surprising results, and keep statisticians on their toes.