Wheat dominated the crop markets today, arising from its slumber on a short covering rally, possibly sparked by concerns about excess moisture in the U.S. southern Plains.
Chicago wheat soared seven percent, the biggest gainer on the day. Kansas July wheat rose 6.7 percent and Minneapolis spring wheat rose 4.9 percent.
The market was subject to a big short covering rally because there was a massive net short in Chicago wheat. That means most participants had positions where they would profit if the price fell.
It didn’t take much to trigger the rally. The U.S. buck weakened a little, weekly exports were slightly better than expected and worries developed about too much rain in the U.S. southern Plains.
Read Also
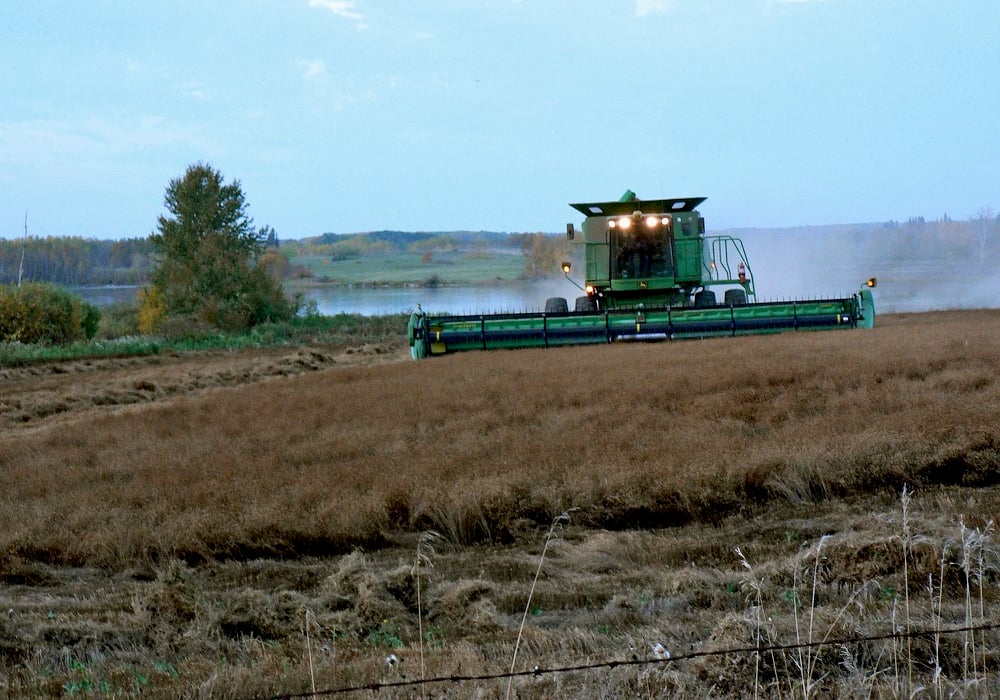
Most of Manitoba harvest wraps up for 2025
Manitoba Agriculture issued its final crop report of 2025, showing the overall provincewide harvest at 97 per cent complete as of Oct. 20. Nearly all major crops have finished combining, with 37 per cent of Manitoba’s sunflowers finished, plus 71 per cent of grain corn and small amounts of soybeans and potatoes left to do.
The wheat crop there is nearing maturity and rain at this point could hurt quality and protein.
“Any news that is out there is basically an excuse. There has been some chatter about maybe some export business, but the larger thing is that we have built up record large short positions,” said Arlan Suderman, market analyst with Water Street Solutions told Reuters.
“Particularly with the dollar being weaker, you increase money flow into the broader commodity sector, and you start getting these fund managers saying ‘I am going to take some profits on my big short positions.'”
In canola, the July contract edged up a few cents a bushel on short covering.
Farmers are busy with seeding and so are not delivering.
Today, Saskatchewan Agriculture said seeding is 34 percent complete in the province, up from the five-year average of nine percent.
The temperature in large areas of the central prairies is expected to fall well below the freezing point on Saturday night-Sunday morning.
The forecast low for Saskatchewan centres, including Saskatoon, Rosetown and North Battleford is -5C. Newly emerged canola could be damaged.
Sunday night is also expected to have frost, particularly in Manitoba.
Soybeans did not rise today.
They were pressured after Informa Economics projected the soybean area at 87.2 million acres, more than 2.5 million acres above the U.S. Agriculture Department’s current forecast.
Soybean supply is ample and stocks could rise in the new year.
The USDA this week projected that U.S. 2015-16 soy ending stocks would reach 500 million bushels, up from 350,000 tonnes at the end of the current crop year and the most in nine years, based on its plantings forecast of 84
Corn followed wheat higher, even though weekly export sales were less than expected.
Informa put U.S. 2015 corn plantings at 88.737 million acres, slightly below USDA’s March forecast of 89.199 million.
Light crude oil nearby futures in New York were down 62 cents to US$59.88 per barrel.
The Canadian dollar at noon was US83.39 cents, down from 83.68 cents the previous trading day. The U.S. dollar at noon was C$1.1992.
The TSX composite rose 47.40 points or 0.32 percent to 15,028.12
The Dow Jones industrial average rose 191.75 points, or 1.06 percent, to 18,252.24.
The S&P 500 gained 22.59 points, or 1.08 percent, to 2,121.07 a new record high.
The Nasdaq Composite added 69.10 points, or 1.39 percent, to 5,050.80.
Winnipeg ICE Futures Canada dollars per tonne
Canola Jul 2015 456.20 +1.70 +0.37%
Canola Nov 2015 450.20 +2.70 +0.60%
Canola Jan 2016 451.90 +2.40 +0.53%
Canola Mar 2016 451.20 +2.40 +0.53%
Canola May 2016 451.70 +2.40 +0.53%
Milling Wheat Jul 2015 210.00 +9.00 +4.48%
Milling Wheat Oct 2015 215.00 +10.00 +4.88%
Milling Wheat Dec 2015 215.00 +10.00 +4.88%
Durum Wheat Jul 2015 298.00 unch 0.00%
Durum Wheat Oct 2015 298.00 unch 0.00%
Durum Wheat Dec 2015 303.00 unch 0.00%
Barley Jul 2015 194.00 -3.00 -1.52%
Barley Oct 2015 177.00 -3.00 -1.67%
Barley Dec 2015 182.00 -3.00 -1.62%
American crop prices in cents US/bushel, soybean meal in $US/short ton, soy oil in cents US/pound
Chicago
Soybeans Jul 2015 957 -0.25 -0.03%
Soybeans Aug 2015 950.25 unch 0.00%
Soybeans Sep 2015 940.25 +1.5 +0.16%
Soybeans Nov 2015 937 +2.5 +0.27%
Soybeans Jan 2016 944 +3 +0.32%
Soybeans Mar 2016 949.25 +2.75 +0.29%
Soybean Meal Jul 2015 302.2 -0.2 -0.07%
Soybean Meal Aug 2015 300.7 unch 0.00%
Soybean Meal Sep 2015 298.9 unch 0.00%
Soybean Oil Jul 2015 33.34 +0.1 +0.30%
Soybean Oil Aug 2015 33.37 +0.1 +0.30%
Soybean Oil Sep 2015 33.4 +0.09 +0.27%
Corn Jul 2015 368 +5.75 +1.59%
Corn Sep 2015 374.5 +6.25 +1.70%
Corn Dec 2015 384.75 +6.25 +1.65%
Corn Mar 2016 395.5 +5.75 +1.48%
Corn May 2016 403 +5.75 +1.45%
Oats Jul 2015 247.5 +11.75 +4.98%
Oats Sep 2015 253.5 +11.75 +4.86%
Oats Dec 2015 262.5 +11.75 +4.69%
Oats Mar 2016 269 +11.5 +4.47%
Oats May 2016 275.5 +11.25 +4.26%
Wheat Jul 2015 514.25 +32.75 +6.80%
Wheat Sep 2015 521 +33 +6.76%
Wheat Dec 2015 536.25 +31.75 +6.29%
Wheat Mar 2016 551.25 +30.25 +5.81%
Wheat May 2016 561.5 +30 +5.64%
Minneapolis
Spring Wheat Jul 2015 566.5 +26.5 +4.91%
Spring Wheat Sep 2015 577.5 +25.75 +4.67%
Spring Wheat Dec 2015 592.25 +26.25 +4.64%
Spring Wheat Mar 2016 606.5 +26.5 +4.57%
Spring Wheat May 2016 615.25 +27 +4.59%
Kansas City
Hard Red Wheat Jul 2015 543.25 +33.75 +6.62%
Hard Red Wheat Sep 2015 553 +33.75 +6.50%
Hard Red Wheat Dec 2015 567.25 +33 +6.18%
Hard Red Wheat Mar 2016 579.5 +32.75 +5.99%
Hard Red Wheat May 2016 587.75 +33 +5.95%