Spring wheat futures jumped more than two percent higher mostly on concerns about high winds in Kansas and talk that Crimea might not seed a spring grain crop.
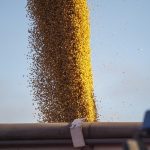
Canola also jumped more than 1.5 percent higher while corn, oats and new crop soybean had more modest gains.
Wheat broke through a technical barrier of its 200-day moving average.
Crimea, the focus of the dispute between Russia and Ukraine, is not that important to the country’s grain production, with an over all grain crop of about 1.2 million tonnes. The bigger questions are how much the disruptions affect production in the rest of the country and whether international buyers will look elsewhere for a most stable exporter for supplies.
Read Also
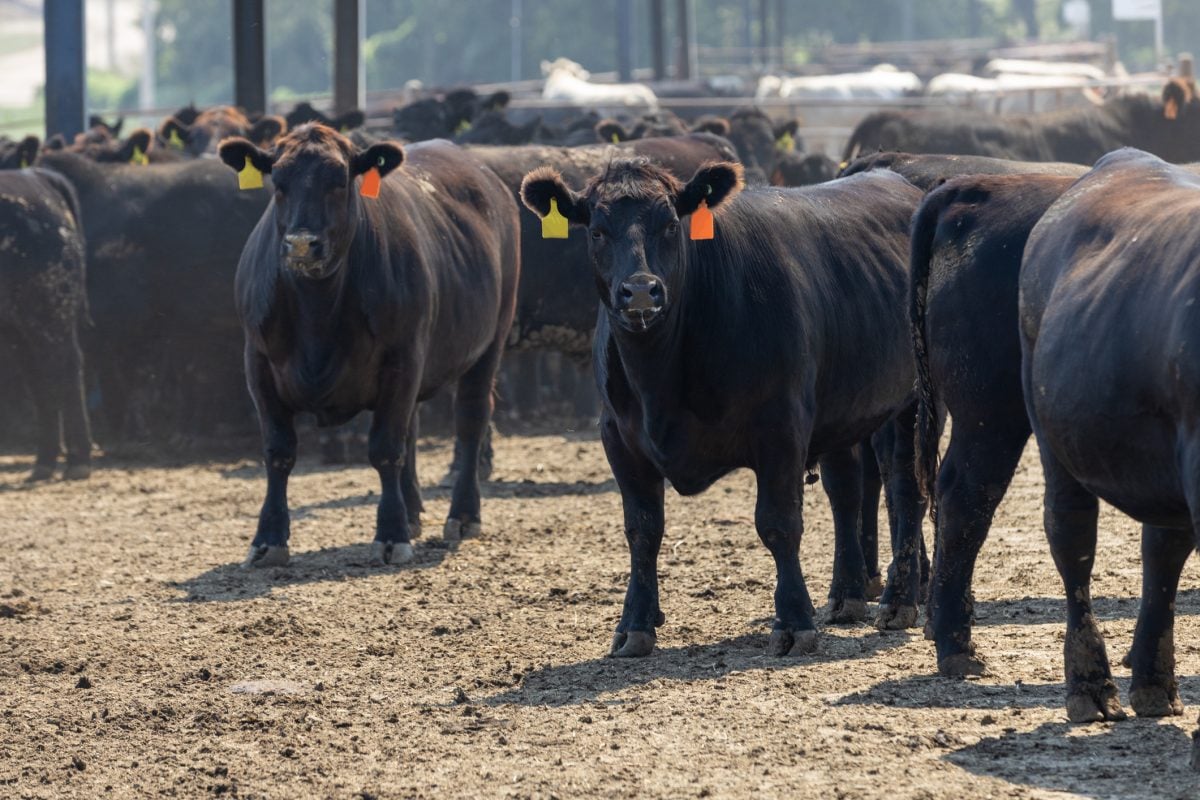
U.S. livestock: Feeder cattle hit contract highs on tight supply
Chicago | Reuters – All Chicago Mercantile Exchange feeder cattle futures and most live cattle futures hit contract highs on…
There were strong wind warnings in Kansas today and dust was causing visibility problems.
In the weekly crop condition report Monday, the USDA in Kansas reported winter wheat condition: five percent very poor (11 percent last year), 13 percent poor (21 last year), 45 percent fair (41 in 2013), 35 percent good (26 last year), and two percent excellent (one percent last year)
The conditions were a slight improvement over last week.
Oklahoma’s winter wheat was 31 percent poor to very poor, 47 percent fair, and 22 percent good to excellent. That showed deterioration from the week before.
The previous week’s ratings were 31 percent poor to very poor, 38 percent fair and 31 percent good to excellent.
Corn followed wheat higher and bounced back a bit from the declines posted Monday following the USDA report.
Canola futures at the Winnipeg ICE Futures exchange gained despite lower old crop soybeans and soy oil.
Canola maintains some technical momentum. Also, some of the trade was related to adjustments between positions held in soybeans and those in canola.
There might also be support from hopes that improved rail performance, caused by the federal government’s demands and warmer weather, could prevent a further build up in year end stocks.
Old crop soybeans fell on thoughts that nearby demand might start shifting to South America, but new crop months rose as the market tried to “buy” acres.
Goldman Sachs raised its three-month prices forecast for Chicago soybean futures to $14.00 per bushel from $12.50 due to tight supplies.
It cuts its acreage forecast by two million acres to 81 million, Reuters reported.
But once acres are secured by strong prices today, soybean prices could sharply decline in the second half of the year as South American supplies post harvest should be abundant. That assumes no weather threat to the U.S. crop, the bank said.
It cut its six-month forecast to $10.50 a bushel from $11.50.
Another factor lurking in the background is data from China showing weaker than expected exports and lack of stability in credit markets.
Winnipeg ICE Futures Canada dollars per tonne
Canola Mar 2014 441.10 +8.40 +1.94%
Canola May 2014 452.00 +8.40 +1.89%
Canola Jul 2014 461.20 +7.90 +1.74%
Canola Nov 2014 478.00 +8.00 +1.70%
Canola Jan 2015 485.40 +8.70 +1.83%
Milling Wheat Mar 2014 206.00 +5.00 +2.49%
Milling Wheat May 2014 212.00 +5.00 +2.42%
Milling Wheat Jul 2014 211.00 +5.00 +2.43%
Durum Wheat Mar 2014 245.00 unch 0.00%
Durum Wheat May 2014 249.00 unch 0.00%
Durum Wheat Jul 2014 250.00 unch 0.00%
Barley Mar 2014 126.50 unch 0.00%
Barley May 2014 128.50 unch 0.00%
Barley Jul 2014 128.50 unch 0.00%
American crop prices in cents US/bushel, soybean meal in $US/short ton, soy oil in cents US/pound
Chicago
Soybeans Mar 2014 1411.5 -7.75 -0.55%
Soybeans May 2014 1413 -5.75 -0.41%
Soybeans Jul 2014 1391.25 -3 -0.22%
Soybeans Aug 2014 1350.75 +5 +0.37%
Soybeans Sep 2014 1247.75 +12.25 +0.99%
Soybeans Nov 2014 1189.5 +13 +1.10%
Soybean Meal Mar 2014 452.3 -0.4 -0.09%
Soybean Meal May 2014 444.2 -0.5 -0.11%
Soybean Meal Jul 2014 433 -0.8 -0.18%
Soybean Oil Mar 2014 43.51 -0.13 -0.30%
Soybean Oil May 2014 43.75 -0.11 -0.25%
Soybean Oil Jul 2014 43.87 -0.11 -0.25%
Corn Mar 2014 478 +6 +1.27%
Corn May 2014 483.25 +5 +1.05%
Corn Jul 2014 487 +4.75 +0.98%
Corn Sep 2014 483.25 +4 +0.83%
Corn Dec 2014 481.25 +3.25 +0.68%
Oats Mar 2014 478 +9 +1.92%
Oats May 2014 424.5 +1.25 +0.30%
Oats Jul 2014 373.5 +8.5 +2.33%
Oats Sep 2014 332.5 +8.5 +2.62%
Oats Dec 2014 316.5 +4.25 +1.36%
Wheat Mar 2014 663.25 +18.25 +2.83%
Wheat May 2014 659 +18.25 +2.85%
Wheat Jul 2014 664.25 +18.25 +2.83%
Wheat Sep 2014 672.75 +18.5 +2.83%
Wheat Dec 2014 684 +18.5 +2.78%
Minneapolis
Spring Wheat Mar 2014 751 +5 +0.67%
Spring Wheat May 2014 707 +14.25 +2.06%
Spring Wheat Jul 2014 704.5 +16.25 +2.36%
Spring Wheat Sep 2014 709.5 +17 +2.45%
Spring Wheat Dec 2014 719.75 +18 +2.57%
Kansas City
KCBT Red Wheat Mar 2014 722 +17.25 +2.45%
KCBT Red Wheat May 2014 728.5 +17.25 +2.43%
KCBT Red Wheat Jul 2014 725 +20.5 +2.91%
KCBT Red Wheat Sep 2014 731.25 +19.75 +2.78%
KCBT Red Wheat Dec 2014 741.25 +19.25 +2.67%
Light crude oil nearby futures in New York dropped $1.09 at $100.03 US per barrel.
The Canadian dollar at noon was 90.21 cents US, up from 90.05 cents the previous trading day. The U.S. dollar at noon was $1.1085 Cdn.
In unofficial tallies —
The Toronto Stock Exchange’s S&P/TSX composite index closed down 34.83 points, or 0.24 percent, at 14,267.23.
The Dow Jones industrial average fell 67.56 points or 0.41 percent, to 16,351.12.
The S&P 500 lost 9.52 points or 0.51 percent, to 1,867.65.
The Nasdaq Composite dropped 27.26 points or 0.63 percent, to 4,307.188.