Canola edged higher on Wednesday but wheat was the big gainer, climbing about two percent on concerns about grain quality in Europe and Ukraine and on the conflict in eastern Ukraine.
Russia announced it would impose a one-year ban on certain agricultural imports from countries that have imposed economic sanctions on Russia over its aid to rebels in eastern Ukraine.
Russia has 20,000 troops on the border with Ukraine and there are fears it could invade Ukraine on the pretext of a humanitarian mission.
Canada exports a significant amount of pork to Russia and it might be affected by the ban.
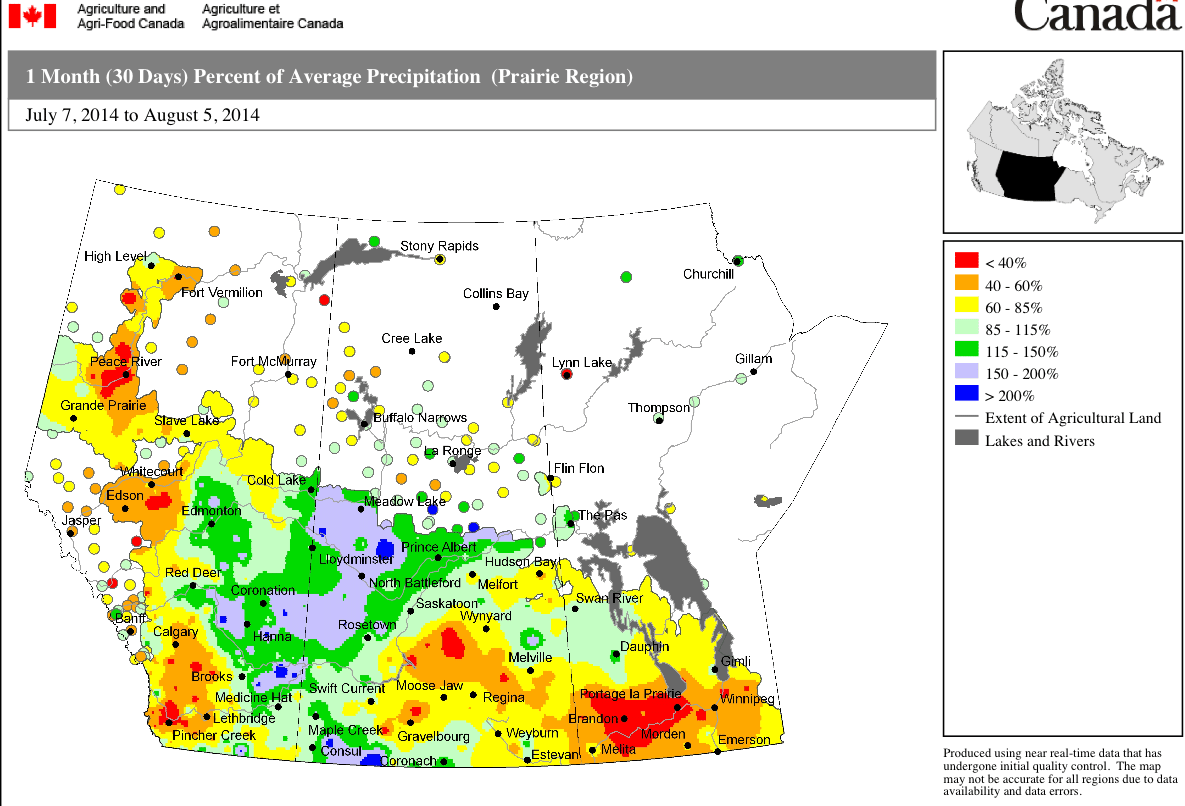
The hot weather in Western Canada is advancing crop development but creating stress for late flowering canola.
Read Also

U.S. grains: Soybeans, corn fall on harvest pressure
U.S. corn and soybean futures were lower on Monday in choppy trade, pressured by the expanding Midwest harvest of both crops, but uncertainty about quarterly government stocks data due on Tuesday kept a floor under prices, analysts said.
The general uncertainty caused by Russia actions added support to grain futures. All crop futures were up today.
Gains were limited by expectations of good production in areas of Western Canada not hurt by spring excess moisture. Also, expectations for record U.S. crops weighed on prices
Reuters releases several polls of analysts ahead of the U.S. Department of Agriculture monthly report due Aug. 12.
The average of analyst’s forecast for the size of the U.S. corn crop was 14.253 billion bushels. USDA’s July forecast was 13.86 billion. Last year’s crop was 13.925 billion.
The average of forecast for U.S. soybeans is 3.823 billion bu. USDA’s July forecast was 3.8 billion. Last year’s crop was 3.289 billion.
The Reuters polls expect world year-end supplies of major crops to increase.
The average of world 2014-15 year end stocks estimates for corn was 192.53 million tonnes, up from USDA’s July forecast of 188.05 million. The forecast for 2013-14 corn year-end stocks is 172.85 million tonnes,
The 2014-15 world wheat stocks average estimate is 190.41 million tonnes, up from USDA’s July forecast of 189.54. The estimate for 2013-14 ending stocks is 184.25 million
For soybeans, the 2014-15 world stocks average estimate is 85.90 million tonnes, up from USDA’s July forecast of 85.31.
The trade average forecast for 2013-14 is 67.32 million tonnes.
Winnipeg ICE Futures Canada dollars per tonne
Canola Nov 2014 442.00 +2.70 +0.61%
Canola Jan 2015 446.90 +2.50 +0.56%
Canola Mar 2015 447.80 +2.50 +0.56%
Canola May 2015 444.40 +2.70 +0.61%
Canola Jul 2015 439.90 +2.60 +0.59%
Milling Wheat Oct 2014 198.00 +4.00 +2.06%
Milling Wheat Dec 2014 203.00 +4.00 +2.01%
Milling Wheat Mar 2015 205.00 +5.00 +2.50%
Durum Wheat Oct 2014 250.00 unch 0.00%
Durum Wheat Dec 2014 256.00 unch 0.00%
Durum Wheat Mar 2015 257.00 unch 0.00%
Barley Oct 2014 136.50 unch 0.00%
Barley Dec 2014 138.50 unch 0.00%
Barley Mar 2015 139.50 unch 0.00%
American crop prices in cents US/bushel, soybean meal in $US/short ton, soy oil in cents US/pound
Chicago
Soybeans Aug 2014 1237 +14.25 +1.17%
Soybeans Sep 2014 1096.5 +15 +1.39%
Soybeans Nov 2014 1080 +14.25 +1.34%
Soybeans Jan 2015 1088.25 +14 +1.30%
Soybeans Mar 2015 1095.75 +13.5 +1.25%
Soybeans May 2015 1102 +13 +1.19%
Soybean Meal Aug 2014 388 +5.8 +1.52%
Soybean Meal Sep 2014 361 +5.3 +1.49%
Soybean Meal Oct 2014 350.7 +4.4 +1.27%
Soybean Oil Aug 2014 35.79 +0.32 +0.90%
Soybean Oil Sep 2014 35.86 +0.29 +0.82%
Soybean Oil Oct 2014 35.96 +0.3 +0.84%
Corn Sep 2014 363.25 +7 +1.96%
Corn Dec 2014 374.25 +7 +1.91%
Corn Mar 2015 387 +7 +1.84%
Corn May 2015 395 +6.75 +1.74%
Corn Jul 2015 401.75 +6.5 +1.64%
Oats Sep 2014 366 +6 +1.67%
Oats Dec 2014 340.25 +7.25 +2.18%
Oats Mar 2015 325.25 +6.5 +2.04%
Oats May 2015 314.75 +5.25 +1.70%
Oats Jul 2015 311.75 +1 +0.32%
Wheat Sep 2014 568 +15.5 +2.81%
Wheat Dec 2014 586.75 +14 +2.44%
Wheat Mar 2015 605.5 +13 +2.19%
Wheat May 2015 617.75 +13 +2.15%
Wheat Jul 2015 624 +12.25 +2.00%
Minneapolis
Spring Wheat Sep 2014 643 +13.75 +2.19%
Spring Wheat Dec 2014 653.5 +13 +2.03%
Spring Wheat Mar 2015 665.75 +12.25 +1.87%
Spring Wheat May 2015 673.5 +13 +1.97%
Spring Wheat Jul 2015 680.5 +12.75 +1.91%
Kansas City
Hard Red Wheat Sep 2014 656.25 +13.5 +2.10%
Hard Red Wheat Dec 2014 668.75 +12.75 +1.94%
Hard Red Wheat Mar 2015 676 +13.5 +2.04%
Hard Red Wheat May 2015 678.75 +13.25 +1.99%
Hard Red Wheat Jul 2015 669.75 +14.25 +2.17%
Light crude oil nearby futures in New York dropped 46 cents at $96.92 US per barrel.
The Canadian dollar at noon was 91.52 cents US, up from 91.16 cents the previous trading day. The U.S. dollar at noon was $1.0926 Cdn.
The U.S. trade deficit narrowed more than expected in June to the lowest reading since January. Canada’s trade surplus widened to a 2 ½ year high.
But concerns about the Ukraine-Russia situation kept investors cautious.
In early tallies —
The TSX composite rose 14.38 points or 0.10 percent to 15,202.09.
The Dow Jones industrial average rose 13.29 points, or 0.08 percent, to 16,442.76.
The S&P 500 lost 0.04 point, or -0 percent, to 1,920.17.
The Nasdaq Composite added 2.22 points, or 0.05 percent, to 4,355.05.