By D’Arce McMillan
The USDA report today was a little bearish for soybeans and wheat but slightly bullish for corn.
Soybeans, canola and wheat futures finished the day a little lower while corn and oats closed up.
Oilseeds were also pressured by overnight rain in parts of the Midwest that supported the prospect of a record large soybean crop.
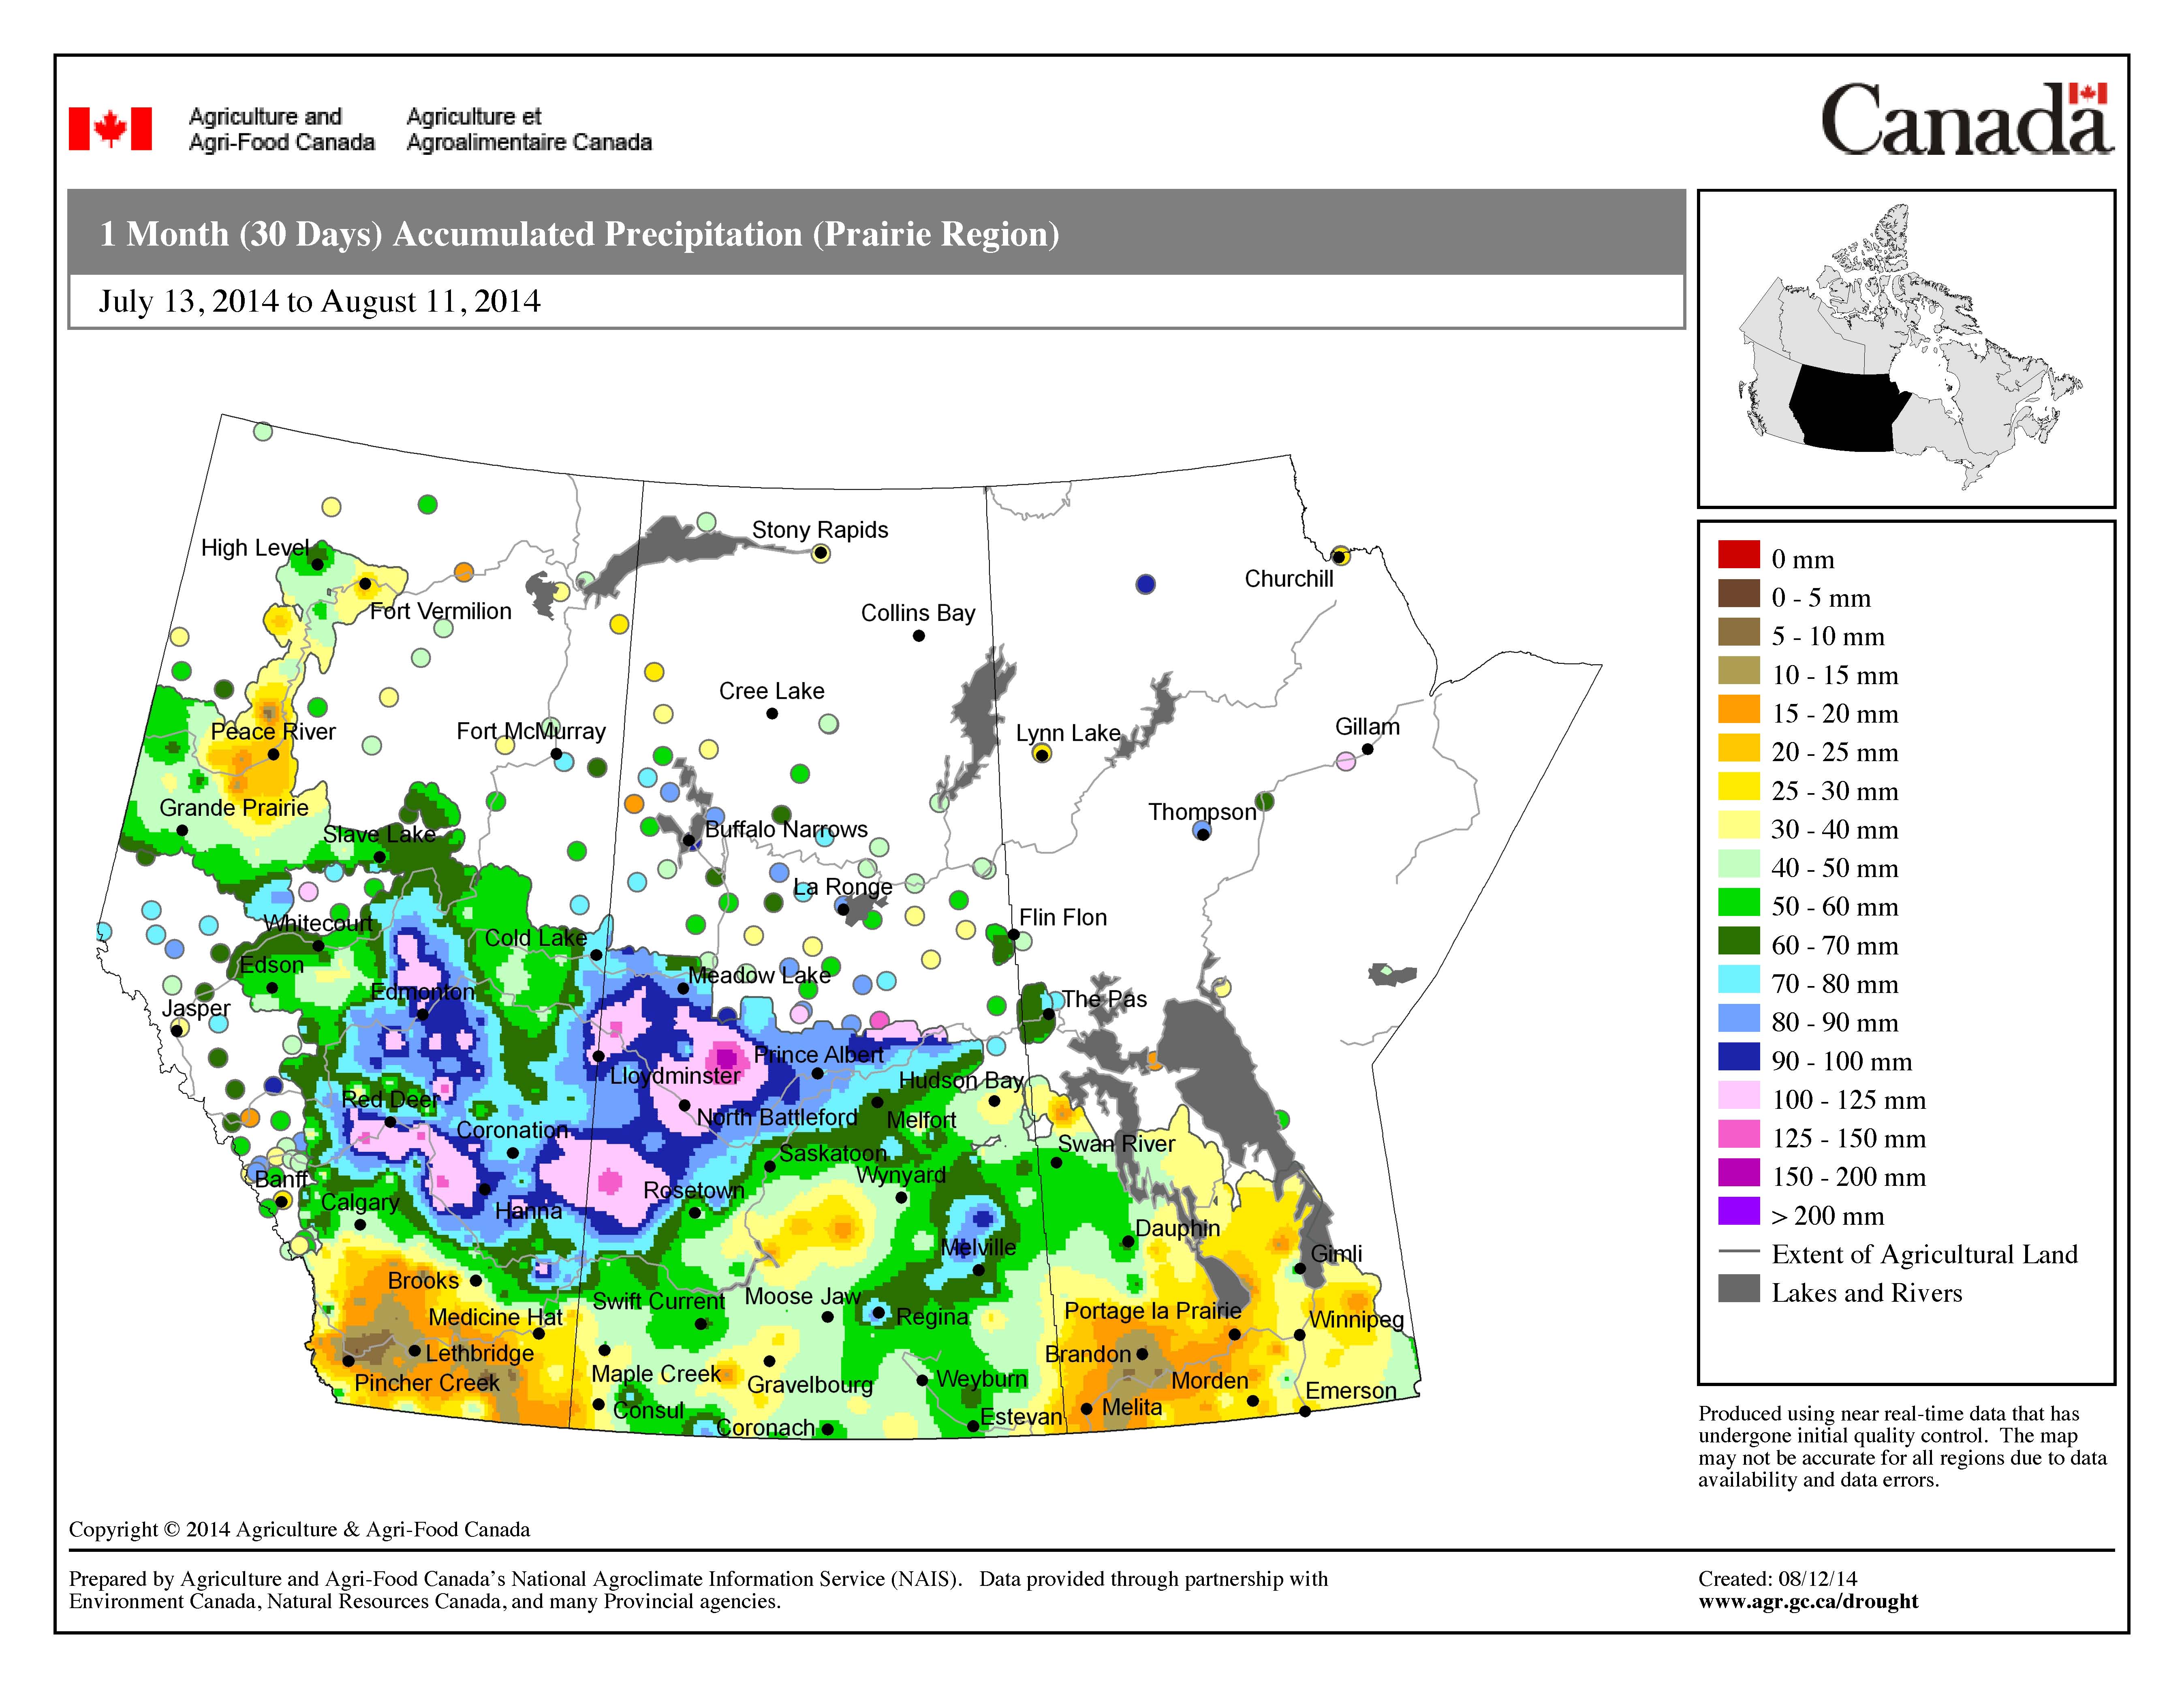
Heat across the Canadian Prairies this week is putting stress on crops, particularly in southern Alberta and the Peace River region, which have seen little rain for most of the summer. Much of Manitoba has also seen little rain in the last 30 days and could use moisture to help with grain filling.
Winter wheat harvest has begun in Manitoba. There are mentions on Twitter of pea harvesting in southern Saskatchewan and durum harvest in southern Alberta.
Read Also

Carney agrees to visit China after meeting Xi
Prime Minister Mark Carney agreed to visit China after meeting with President Xi Jinping on Friday, in an encounter that may have marked a turning point but offered no breakthroughs on trade.
However, most crops have a way to go yet before the combines roll.
Most of the trade’s focus was on the USDA report this morning.
It put U.S. corn yield at 167.4 bushels per acre and production at a record 14.032 billion bu. Trade had expected a yield of 170.1 bu. per acre and a 14.25 billion bu. crop.
USDA said U.S. corn stocks at the end of 2013-14 were 1.181 billion bu., below the trade’s expectation of 1.24 billion.
For 2014-15 it put stocks at 1.808 billion bu., a bit lower than the trade’s guess of 2.005 billion.
All that was a bit bullish, although it can’t be forgotten that the production is a record. And the adage in the trade is that big crops get bigger.
Soybean yield was pegged at 45.4 bu. per acre and production at a record 3.816 billion bu. The trade expected 45.58 bu. per acre and 3.82 billion bu.
That was neutral, but the stocks numbers were a little bearish.
Soybean stocks 2013-14 are 140 million bu., up from the trade forecast of 136 million.
Stocks at the end of 2014-15 are seen at 430 million bu. The trade’s number was 414 million.
The USDA’s forecasts for U.S. wheat production and stocks increased, but that was expected.
It also increased world wheat crop to 716 million tonnes from 705 million in July. It raised Russia’s wheat crop to 59 million tonnes from 53 million last month. It increase China’s wheat crop by two million tonnes to 126 million and Ukraine’s by one million to 22 million.
Global end stocks increase to 192.96 million tonnes from 189.54 million. The trade had expected 190.41 million tonnes. So that was bearish.
Other news that could have a modest effect on markets came from southeastern Australia where frost hit crops. Australian broadcaster ABC said 20 to 30 percent of New South Wales crops have been hit by the coldest temperatures in decades over several days with morning temperatures as low as -3 to -4 C.
A single frost would not have been significant but the repeated cold mornings could have caused damage. It will take time to assess the situation.
Winnipeg ICE Futures Canada dollars per tonne
Canola Nov 2014 435.40 -2.90 -0.66%
Canola Jan 2015 440.40 -2.90 -0.65%
Canola Mar 2015 442.30 -2.70 -0.61%
Canola May 2015 439.80 -2.70 -0.61%
Canola Jul 2015 436.60 -2.80 -0.64%
Milling Wheat Oct 2014 198.00 -2.00 -1.00%
Milling Wheat Dec 2014 203.00 -2.00 -0.98%
Milling Wheat Mar 2015 210.00 -3.00 -1.41%
Durum Wheat Oct 2014 250.00 unch 0.00%
Durum Wheat Dec 2014 256.00 unch 0.00%
Durum Wheat Mar 2015 257.00 unch 0.00%
Barley Oct 2014 136.00 unch 0.00%
Barley Dec 2014 138.00 unch 0.00%
Barley Mar 2015 139.00 unch 0.00%
American crop prices in cents US/bushel, soybean meal in $US/short ton, soy oil in cents US/pound
Chicago
Soybeans Aug 2014 1290 -24.75 -1.88%
Soybeans Sep 2014 1094.25 -14.25 -1.29%
Soybeans Nov 2014 1059.5 -13.75 -1.28%
Soybeans Jan 2015 1068.25 -13.5 -1.25%
Soybeans Mar 2015 1077 -13 -1.19%
Soybeans May 2015 1084 -13.25 -1.21%
Soybean Meal Aug 2014 400.2 -0.2 -0.05%
Soybean Meal Sep 2014 365.2 -2.3 -0.63%
Soybean Meal Oct 2014 347.1 -4.8 -1.36%
Soybean Oil Aug 2014 34.62 -0.26 -0.75%
Soybean Oil Sep 2014 34.64 -0.28 -0.80%
Soybean Oil Oct 2014 34.71 -0.28 -0.80%
Corn Sep 2014 358.5 +1.75 +0.49%
Corn Dec 2014 369 +0.75 +0.20%
Corn Mar 2015 381.75 +0.5 +0.13%
Corn May 2015 390 +0.75 +0.19%
Corn Jul 2015 397 +1 +0.25%
Oats Sep 2014 359.25 +0.25 +0.07%
Oats Dec 2014 332.5 +1.5 +0.45%
Oats Mar 2015 317.25 +2.75 +0.87%
Oats May 2015 310.25 +3.25 +1.06%
Oats Jul 2015 309.75 +2.25 +0.73%
Wheat Sep 2014 538 -8.5 -1.56%
Wheat Dec 2014 551.25 -11.5 -2.04%
Wheat Mar 2015 570.75 -10.5 -1.81%
Wheat May 2015 583.75 -10 -1.68%
Wheat Jul 2015 592.25 -7.75 -1.29%
Minneapolis
Spring Wheat Sep 2014 609 -7.25 -1.18%
Spring Wheat Dec 2014 620.75 -7.5 -1.19%
Spring Wheat Mar 2015 632.25 -7.5 -1.17%
Spring Wheat May 2015 640.25 -7.5 -1.16%
Spring Wheat Jul 2015 647.25 -7 -1.07%
Kansas City
Hard Red Wheat Sep 2014 613.25 -10.5 -1.68%
Hard Red Wheat Dec 2014 626.5 -10.5 -1.65%
Hard Red Wheat Mar 2015 637 -10.25 -1.58%
Hard Red Wheat May 2015 640.5 -10.5 -1.61%
Hard Red Wheat Jul 2015 631.25 -10.75 -1.67%
Light crude oil nearby futures in New York dropped 71 cents at $97.37 US per barrel.
The Canadian dollar at noon was 91.37 cents US, down from 91.45 cents the previous trading day. The U.S. dollar at noon was $1.0944 Cdn.
Statistics Canada said today it made a mistake in its July jobs report for July
It did not say what the error was but said corrected estimates would be released on Aug. 15.
The report had said Canada’s economy created only a net 200 jobs in July, far fewer than analysts had expected. Labour force participation fell to a 13-year low.
In unofficial tallies:
The Toronto Stock Exchange’s S&P/TSX composite index closed up 12.59 points, or 0.08 percent, at 15,274.23.
The Dow Jones industrial average fell 9.44 points or 0.06 percent, to end at 16,560.54.
The S&P 500 slipped 3.17 points or 0.16 percent, to finish at 1,933.75.
The Nasdaq Composite fell 12.08 points or 0.27 percent, to close at 4,389.25.