
Canola closed higher, lifted a little by Statistics Canada data Friday that showed March 31 stocks of the oilseed were tighter than expected.
Technical signals, with the July contract below its 50-day moving average, limited the gains.
StatsCan estimated stocks at a tight 3.909 million tonnes, down almost 25 percent from the same time last year and an eight-year low. The trade in a Reuters poll expected 4.1 million tonnes, on average.
A forecast for generally warm weather on the Prairies that will melt snow and get many farmers closer to seeding lessened the weather risk in the market.
Read Also

U.S. livestock: Cattle, hogs end week on high note
Cattle contracts and nearby hog futures ended the week on a high note after a week rife with losses. Most-traded…
For the week July canola fell $15.10 per tonne and November fell $9.60.
Demand from domestic processors fell.
The Canadian Oilseed Processors Association said members crushed 114,962 tonnes of canola in the week ending May 1, down 21 percent. That represented capacity use of about 69 percent.
• Malaysian palm oil futures slipped to a near five-month low, posting a weekly loss of 2.7 percent.
• Also in the background of traders minds, expectations that delayed seeding in the U.S. could shift acres away from corn and spring wheat into soybeans limited oilseed gains.
• Markets generally were buoyed by news that U.S. employment rose faster than expected in April and hiring was much stronger than previously thought in the prior two months.
• For Kansas hard red winter wheat, it was a case of buy the rumour, sell the fact. It rose all week on concerns about crop damage from drought and freezing weather. A tour of analysts on Thursday predicted the crop would be down 18 percent. Today Kansas wheat fell, but over the week the December contract gained 30.5 cents or about four percent.
• Analysts Informa Economics today estimated 2013 U.S. winter wheat production at 1.529 billion bu, down from its previous forecast of 1.581 billion, Reuters reported.
Output would be down 116.5 million bu. from last year’s crop and 52 million bushels below Informa’s forecast made in mid-April.
Production of U.S. hard red winter wheat was forecast at 798 million bu., down from Informa’s previous forecast for 850 million and down about 21 percent from last year’s U.S. crop of 1.004 billion bushels, trade sources said.
It pegged soft red winter production at 508 million bu., almost unchanged from its previous forecast but above 2012 U.S. output of 420 million.
The U.S. Department of Agriculture will release its first forecast of the winter wheat crop on May 10 along with its monthly grain supply and demand report.
• Statistics Canada’s report today said all-wheat stocks fell eight percent to a lower than expected 13.459 million tonnes, the smallest supplies in five years, and below the expectation of 13.9 million.
Barley stocks were down 10 percent to 2.961 million tonnes and oat stocks fell 30 percent to 1.214 million tonnes, both more than expected, according to a Reuters survey.
Durum was pegged at 2.663 million tonnes, down 14 percent, in line with expectations.
StatsCan surveyed farmers from March 25 to April 3. It will issue planting estimates on June 25.
• Markets next week will eagerly anticipate the USDA seeding progress report released after the market closed Monday.
Spot corn prices were up 8.6 percent for the week, because of seeding delays.
The Saskatchewan Agriculture crop report said by May 7 last year five percent of crops were sown and the five-year average was four percent. In 2011 only one percent was seeded. There will likely be virtually nothing sown by that date this year.
• Speculator non-commercial traders, which had been increasing the number of short positions they hold in expectation of bigger U.S. crops, are now reducing those short positions. They are more bullish now that weather is delaying seeding. However, they remain net short in corn and wheat and are net long in soybeans.
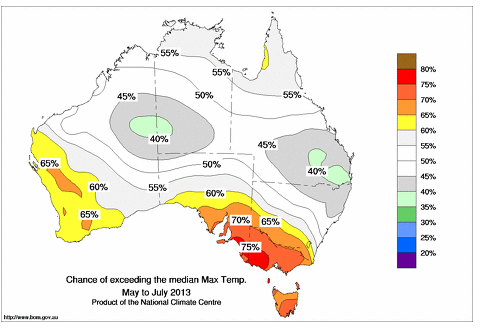
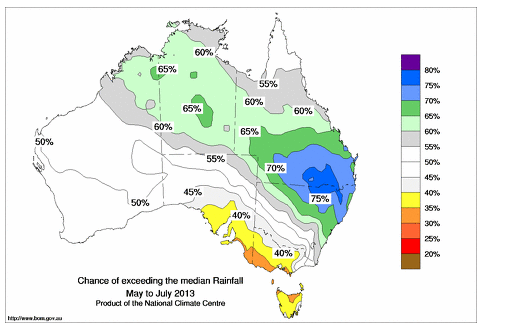
• South eastern Australia remains very dry. Key production regions in New South Wales, Victoria and South Australia are forecast to get normal to below normal rain in the coming months and the region is expected to be warmer than normal.
Queensland, a smaller grain producer, is expected to get good rain. Western Australia is expected to get normal moisture and above normal temperatures.

Winnipeg ICE Futures Canada dollars per tonne
Canola May 2013 630.40 -2.80 -0.44%
Canola Jul 2013 601.40 +1.20 +0.20%
Canola Nov 2013 541.30 +2.60 +0.48%
Canola Jan 2014 542.70 +2.60 +0.48%
Canola Mar 2014 539.00 +2.60 +0.48%
Milling Wheat May 2013 292.00 unch 0.00%
Milling Wheat Jul 2013 294.00 unch 0.00%
Milling Wheat Oct 2013 294.00 unch 0.00%
Durum Wheat May 2013 301.90 unch 0.00%
Durum Wheat Jul 2013 301.90 unch 0.00%
Durum Wheat Oct 2013 294.90 unch 0.00%
Barley May 2013 243.50 unch 0.00%
Barley Jul 2013 244.00 unch 0.00%
Barley Oct 2013 194.00 unch 0.00%
American crop prices in cents US/bushel, soybean meal in $US/short ton, soy oil in cents US/pound
Chicago
Soybeans May 2013 1455 +14 +0.97%
Soybeans Jul 2013 1387.25 +15 +1.09%
Soybeans Aug 2013 1335.25 +17 +1.29%
Soybeans Sep 2013 1265.75 +18.25 +1.46%
Soybeans Nov 2013 1221.25 +17.25 +1.43%
Soybeans Jan 2014 1228.75 +17 +1.40%
Soybean Meal May 2013 417.8 -0.8 -0.19%
Soybean Meal Jul 2013 406.5 +0.3 +0.07%
Soybean Meal Aug 2013 387.2 +3.7 +0.96%
Soybean Oil May 2013 49.16 +0.74 +1.53%
Soybean Oil Jul 2013 49.27 +0.78 +1.61%
Soybean Oil Aug 2013 49.01 +0.7 +1.45%
Corn May 2013 699.5 +2 +0.29%
Corn Jul 2013 661.25 -0.75 -0.11%
Corn Sep 2013 579.25 -4.5 -0.77%
Corn Dec 2013 553.5 -5.5 -0.98%
Corn Mar 2014 563.5 -5.5 -0.97%
Oats May 2013 421.5 +5.25 +1.26%
Oats Jul 2013 388 +1.75 +0.45%
Oats Sep 2013 371 +3.25 +0.88%
Oats Dec 2013 364 +3.25 +0.90%
Oats Mar 2014 367.75 +2.25 +0.62%
Wheat May 2013 711.25 -7.5 -1.04%
Wheat Jul 2013 721 -7.5 -1.03%
Wheat Sep 2013 730.5 -7.5 -1.02%
Wheat Dec 2013 745.25 -7 -0.93%
Wheat Mar 2014 758.5 -7 -0.91%
Minneapolis
Spring Wheat May 2013 858.5 +13.75 +1.63%
Spring Wheat Jul 2013 819 -6.25 -0.76%
Spring Wheat Sep 2013 819.25 -8.25 -1.00%
Spring Wheat Dec 2013 828.5 -8.5 -1.02%
Spring Wheat Mar 2014 840.25 -9.5 -1.12%
Kansas City
KCBT Red Wheat May 2013 790 -12.25 -1.53%
KCBT Red Wheat Jul 2013 778 -12.75 -1.61%
KCBT Red Wheat Sep 2013 788.75 -11.75 -1.47%
KCBT Red Wheat Dec 2013 805.75 -9 -1.10%
KCBT Red Wheat Mar 2014 818 -7.25 -0.88%
Light crude oil nearby futures in New York rose $1.62 at $95.61 US per barrel.
The Canadian dollar at noon was 99.22 cents US, up from 99.18 cents the previous trading day. The U.S. dollar at noon was $1.0079 Cdn.
The stronger than expected jobs performance in the U.S. lifted equity markets.
The Toronto Stock Exchange’s S&P/TSX composite index rose 58.39 points, or 0.47 percent, at 12,438.03. The day’s high was 12,533.83, the index’s highest level since April 11.
The Dow Jones industrial average was up 140.61 points, or 0.95 percent, at 14,972.19.
The Standard & Poor’s 500 Index was up 16.63 points, or 1.04 percent, at 1,614.22.
The Nasdaq Composite Index was up 38.01 points, or 1.14 percent, at 3,378.63.
Both the Dow and S&P ended at all-time closing highs.
For the week, the TSX rose 1.8, the Dow rose 1.8 percent, the S&P gained two percent and the Nasdaq rose three percent.


