
 A stronger loonie and harvest progress weighed on canola futures Friday, finishing a week that saw sharp declines.
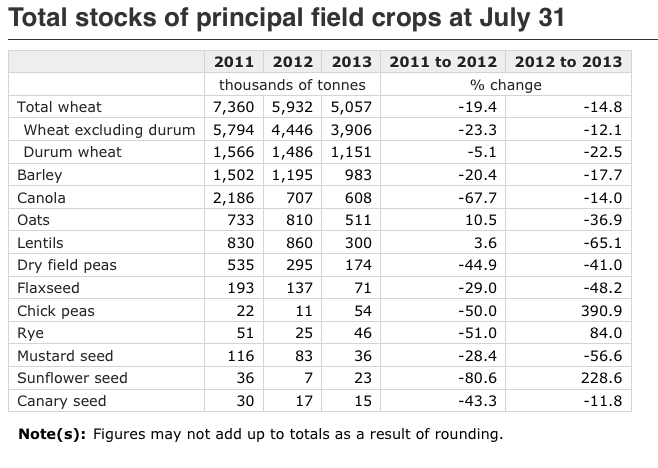
November closed below the psychologically important $500 level despite a mildly bullish Statistics Canada July 31 stocks report.
Read Also

U.S. livestock: Cattle, hogs end week on high note
Cattle contracts and nearby hog futures ended the week on a high note after a week rife with losses. Most-traded…
The agency pegged year-end canola stocks at 608,000 tonnes, below the average of a Reuters poll of analysts, which put stocks at 730,000.
The previous year, year-end stocks were 707,000 tonnes.
However, the news regarding tighter stocks was buried under expectations for a record size harvest.
On the week November canola fell $24.10 per tonne or 4.6 percent while November soybeans gained 10.25 cents per bushel or 0.76 percent.
U.S. corn, wheat and soybean future all closed higher Friday, although November soybeans were up only two cents.
Short covering ahead of the Sept. 12 USDA supply and demand reports helped lift U.S. crop futures, as did a lower U.S. dollar.
The Canadian dollar rose against the U.S. buck on differing monthly jobs reports.
Canada’s economy created 59,200 jobs in August, nearly triple the number expected, but most of the gains were in part-time work. The unemployment rate dipped to 7.1 percent from 7.2 percent.
The U.S. created 169,000 jobs last month, a little less than the expected 175,000 jobs. Also the June and July counts were revised down by 75,000 jobs.
The weak jobs numbers give weight to the idea that the Federal Reserve will not start to ease its stimulus program.
Weather Network is predicting another above average week coming for temperatures on Prairies. Then temperatures dip to below normal starting Monday Sept. 16 and last through that week but still no frost is expected.
Showers starting in Alberta today and moving east as the weekend progresses could cause harvest delays. The largest accumulations are forecast for southern regions.
Statistics Canada said stocks of wheat were 5.057 million tonnes, down 14.8 percent from 5.932 million last year and just below the average trade estimate of 5.13 million.
On Sept. 12 USDA will release its monthly crop size forecasts and demand outlooks.
Analysts polled by Reuters had the following pre report estimates.
On average they pegged the U.S. corn crop at 13.62 billion bushels based on a yield of 153.69 bu. per acre and harvest acreage of 88.559 million acres.
USDA’s August report put the crop at 13.763 billion bu. with a yield of 154 bu. per acre and harvested acres of 89.1 million acres.
The average of the Reuters poll on soybeans was 3.14 billion bu. with a yield of 41.172 bu. per acre and harvested area of 76.248 acres.
In August USDA forecast 3.255 billion bushels, a yield of 42.6 bu. per acre and harvested area of 76.4 million acres.
Winnipeg ICE Futures Canada dollars per tonne
Canola Nov 2013 498.20 -10.60 -2.08%
Canola Jan 2014 505.90 -10.60 -2.05%
Canola Mar 2014 511.70 -10.40 -1.99%
Canola May 2014 515.50 -10.90 -2.07%
Canola Jul 2014 517.90 -11.00 -2.08%
Milling Wheat Oct 2013 246.00 +1.00 +0.41%
Milling Wheat Dec 2013 252.00 +1.00 +0.40%
Milling Wheat Mar 2014 257.00 +1.00 +0.39%
Durum Wheat Oct 2013 259.00 -10.00 -3.72%
Durum Wheat Dec 2013 267.00 -8.00 -2.91%
Durum Wheat Mar 2014 273.00 -8.00 -2.85%
Barley Oct 2013 189.00 unch 0.00%
Barley Dec 2013 194.00 unch 0.00%
Barley Mar 2014 194.00 unch 0.00%
American crop prices in cents US/bushel, soybean meal in $US/short ton, soy oil in cents US/pound
Chicago
Soybeans Sep 2013 1437 +14 +0.98%
Soybeans Nov 2013 1367.75 +0.25 +0.02%
Soybeans Jan 2014 1365.25 +1 +0.07%
Soybeans Mar 2014 1343 -0.75 -0.06%
Soybeans May 2014 1310.75 -4.75 -0.36%
Soybeans Jul 2014 1304.25 -5 -0.38%
Soybean Meal Sep 2013 482.1 +2.6 +0.54%
Soybean Meal Oct 2013 434.7 +0.1 +0.02%
Soybean Meal Dec 2013 428.9 -0.5 -0.12%
Soybean Oil Sep 2013 43.36 +0.17 +0.39%
Soybean Oil Oct 2013 43.43 +0.17 +0.39%
Soybean Oil Dec 2013 43.72 +0.19 +0.44%
Corn Sep 2013 491.5 +2 +0.41%
Corn Dec 2013 468.25 +7.25 +1.57%
Corn Mar 2014 481 +7 +1.48%
Corn May 2014 489.5 +7 +1.45%
Corn Jul 2014 495.5 +6.75 +1.38%
Oats Sep 2013 368.5 -6 -1.60%
Oats Dec 2013 319.5 -6 -1.84%
Oats Mar 2014 324.5 -5 -1.52%
Oats May 2014 327 -3.25 -0.98%
Oats Jul 2014 318 -3.25 -1.01%
Wheat Sep 2013 635 +7.75 +1.24%
Wheat Dec 2013 647.75 +7.5 +1.17%
Wheat Mar 2014 660.25 +7 +1.07%
Wheat May 2014 668.5 +7.25 +1.10%
Wheat Jul 2014 662.75 +7.25 +1.11%
Minneapolis
Spring Wheat Sep 2013 707.75 +1.75 +0.25%
Spring Wheat Dec 2013 712.75 +1.5 +0.21%
Spring Wheat Mar 2014 726.25 +1.25 +0.17%
Spring Wheat May 2014 734.25 +1.5 +0.20%
Spring Wheat Jul 2014 741.25 +3.25 +0.44%
Kansas City
KCBT Red Wheat Sep 2013 708.5 +7.25 +1.03%
KCBT Red Wheat Dec 2013 695.5 +6.25 +0.91%
KCBT Red Wheat Mar 2014 703.5 +6.5 +0.93%
KCBT Red Wheat May 2014 708.5 +6.75 +0.96%
KCBT Red Wheat Jul 2014 696.75 +3.5 +0.50%
Light crude oil nearby futures in New York rose $2.16 at $110.53 US per barrel.
The Canadian dollar at noon was 96.25 cents US, up from 95.24 cents the previous trading day. The U.S. dollar at noon was $1.0390 Cdn.
In early tallies —
The Toronto Stock Exchange’s S&P/TSX composite index closed down 24.14 points, or 0.19 percent, at 12,820.92.
The Dow Jones industrial average was down 14.90 points, or 0.10 percent, at 14,922.58.
The Standard & Poor’s 500 Index was up 0.07 points, or 0.00 percent, at 1,655.15.
The Nasdaq Composite Index was up 1.23 points, or 0.03 percent, at 3,660.01.
For the week, the TSX composite rose 1.3 percent, the Dow rose 0.8 percent, the S&P 500 finished up 1.4 percent and the Nasdaq climbed two percent.


