
Canola futures closed higher Friday, supported by a weaker loonie, stronger crude oil and a feeling that Thursday’s losses were overdone.
On the day November canola gained $3.10. Over the week November gained $2.90
The biggest market news was strong U.S. June jobs data at 195,000 new positions, up 30,000 over expectations. The data served to underline the Federal Reserve’s intention to scale back its stimulus program and that pushed the U.S. dollar sharply higher against most currencies, including the Canadian dollar.
The stronger U.S. dollar put downward pressure on most commodities except oil, which rose on expectation of increasing demand and on the unrest in Egypt. Stronger crude helped lift vegetable oil.
Read Also

U.S. livestock: Cattle, hogs end week on high note
Cattle contracts and nearby hog futures ended the week on a high note after a week rife with losses. Most-traded…
Weather remains mostly conducive to canola development. Cooler weather and showers over the next few days should lower the stress on crops caused by the hot weather early this week.
Weather is about ideal in the U.S. Midwest and Northern Plains, pressuring new crop soybean, corn and wheat. December corn fell below $5 per bushel, marking a 2 1/2 year low.
Saskatchewan crops are catching up on their development thanks to the arrival of warmer weather.
Sixty percent of oilseeds were at a normal stage of development for this time of year, up from 51 percent last week.
Spring cereals were at 61 percent, up from 57 percent last week.
Pulses were at 68 percent, up from 61 percent.
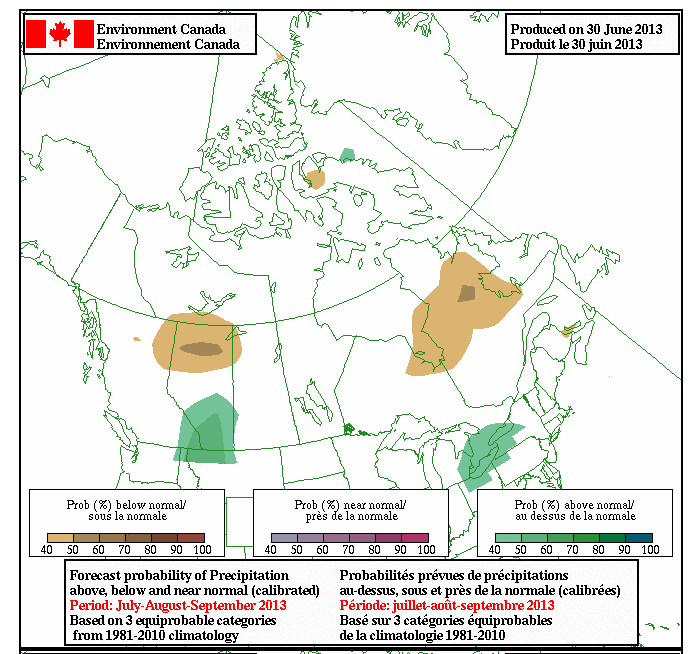
Environment Canada’s latest three month forecast calls for a slightly stronger than normal change of above average temperatures across the Prairies July-September. Above normal rainfall is expected in southern Alberta and normal rainfall in the rest of the Prairies.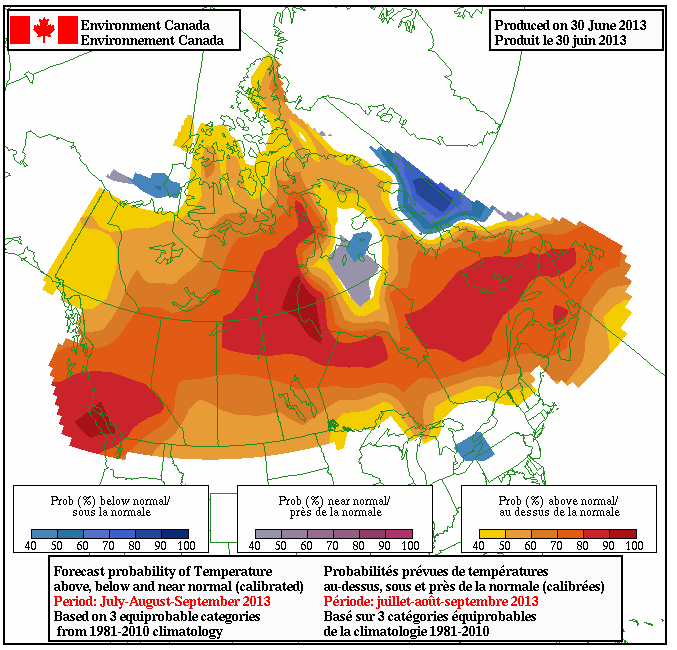

The Canadian Oilseed Processors Association reported members crushed 116,057 tonnes of canola in the week ending July 3, down 5.6 percent from the week before. That represented a capacity use of almost 70 percent.
Wheat’s losses were limited by support from recent U.S. and Australian wheat sales to China.
Australia expects a bigger wheat crop this year but recent dry weather in Western Australia might trim production from early forecasts.
In mid June the Australian Bureau of Agriculture and Resource Economics and Sciences forecast the wheat crop at 25.4 million tonnes, USDA’s figure is 24.5 million tonnes, up from 22.1 million last year.
National Australia Bank Ltd. on Thursday pegged the crop at 24 million tonnes.
Although the crop is up from last year, the carry in will be small resulting in a reduction of total wheat available and exports are expected to decline from 2012-13.
According to a Bloomberg poll of 25 analysts, corn traders are the most bearish since 2010 as prospects improve for a big U.S. corn crop.
Fifteen of 25 analysts surveyed by Bloomberg expect prices to fall next week, with six bullish and four neutral, the largest proportion of bears since November 2010, Bloomberg said.
USDA releases its monthly supply and demand reports on July 11.
Indian newspapers report that India’s Commission for Agricultural Costs and Prices, which advises the government on price policy for agricultural commodities, has recommended a 10 percent import tax on pulses to protect local growers. Domestic prices for some types of pulses, especially tur dal have fallen sharply in recent weeks as the summer harvest moves to market.
ICE Futures Canada in dollars power tonne
Canola Jul 2013 607.70 +2.60 +0.43%
Canola Nov 2013 537.70 +3.10 +0.58%
Canola Jan 2014 542.70 +3.10 +0.58%
Canola Mar 2014 544.30 +1.80 +0.33%
Canola May 2014 543.80 +1.80 +0.33%
Milling Wheat Jul 2013 0.00 unch 0.00%
Milling Wheat Oct 2013 0.00 unch 0.00%
Milling Wheat Dec 2013 0.00 unch 0.00%
Durum Wheat Jul 2013 0.00 unch 0.00%
Durum Wheat Oct 2013 0.00 unch 0.00%
Durum Wheat Dec 2013 0.00 unch 0.00%
Barley Jul 2013 0.00 unch 0.00%
Barley Oct 2013 0.00 unch 0.00%
Barley Dec 2013 0.00 unch 0.00%
U.S. crops in cents US per bushel, soy meal in $US per short ton, soy oil in cents US per pound
Chicago
Soybeans Jul 2013 1588 +4.5 +0.28%
Soybeans Aug 2013 1432 -9.25 -0.64%
Soybeans Sep 2013 1276.25 -21.25 -1.64%
Soybeans Nov 2013 1228.25 -22.5 -1.80%
Soybeans Jan 2014 1233.75 -22.75 -1.81%
Soybeans Mar 2014 1235.5 -23.25 -1.85%
Soybean Meal Jul 2013 489.1 -1.5 -0.31%
Soybean Meal Aug 2013 428.6 -4 -0.92%
Soybean Meal Sep 2013 386.7 -9.1 -2.30%
Soybean Oil Jul 2013 47.23 +0.01 +0.02%
Soybean Oil Aug 2013 47.14 +0.03 +0.06%
Soybean Oil Sep 2013 46.79 +0.11 +0.24%
Corn Jul 2013 684.75 +6.5 +0.96%
Corn Sep 2013 525.75 -6.5 -1.22%
Corn Dec 2013 491.25 -11.5 -2.29%
Corn Mar 2014 503.5 -11.25 -2.19%
Corn May 2014 511.25 -11.25 -2.15%
Oats Jul 2013 399.25 +7.25 +1.85%
Oats Sep 2013 360.25 +1.25 +0.35%
Oats Dec 2013 345.25 +3.5 +1.02%
Oats Mar 2014 350.5 +3.25 +0.94%
Oats May 2014 356 +3.25 +0.92%
Wheat Jul 2013 656 -1.75 -0.27%
Wheat Sep 2013 660 -5 -0.75%
Wheat Dec 2013 670.5 -7 -1.03%
Wheat Mar 2014 683.25 -8.25 -1.19%
Wheat May 2014 688.5 -8.75 -1.25%
Minneapolis
Spring Wheat Jul 2013 761.25 unch 0.00%
Spring Wheat Sep 2013 763.5 -6.75 -0.88%
Spring Wheat Dec 2013 772 -7.75 -0.99%
Spring Wheat Mar 2014 787.75 -8 -1.01%
Spring Wheat May 2014 795.25 -9 -1.12%
Kansas City
KCBT Red Wheat Jul 2013 676.5 -7 -1.02%
KCBT Red Wheat Sep 2013 685.75 -8.75 -1.26%
KCBT Red Wheat Dec 2013 706.25 -10 -1.40%
KCBT Red Wheat Mar 2014 720.25 -9.75 -1.34%
KCBT Red Wheat May 2014 727.5 -9.25 -1.26%
Crude oil in New York closed at $103.22, up $1.98 per barrel. Over the week, crude gained $6.66 or almost seven percent.
The Bank of Canada noon rate for the loonie was 94.63 cents U.S., down almost a half cent from 95.12 on Thursday. The U.S. buck was $1.0568 Cdn.
U.S. stocks initially weakened after the jobs data was released on the worry about the Fed stimulus, but then gained when apparently traders looked at the positive aspects of more jobs and a stronger economy. Because the U.S. jobs data knocked gold down further, the mining-heavy TSX composite fell.
In early unofficial tallies —
The Toronto Stock Exchange’s S&P/TSX composite index fell 31.75 points, or 0.26 percent, at 12,134.91.
The Dow Jones industrial average was up 147.29 points, or 0.98 percent, at 15,135.84.
The Standard & Poor’s 500 Index rose 16.48 points, or 1.02 percent, at 1,631.89.
The Nasdaq Composite Index was up 35.71 points, or 1.04 percent, at 3,479.38.


