The inversion between old and new crop canola narrowed slightly this week with July falling $2.30 since last Friday and November gaining $6.20.
On Friday old crop July took it on the nose, dropping $7.90 to $634.50 while November climbed $1.90 to $557.50.
The weakness in old crop was mainly associated with spread trade between old and new crop and with falling old crop soybean prices.
There is some thought that the old crop squeeze that had pushed July soybeans to multi month highs had hit a ceiling on Thursday, causing the sharp swings in prices that day. Also, U.S. markets were adjusting today, not wanting to carry too much risk ahead of the Memorial Day long weekend.
Read Also

U.S. livestock: Cattle make gains, hogs mixed
Most Chicago cattle futures rose on Wednesday after Tuesday’s hard fall. Hogs settled on either side of unchanged. Most-active October…
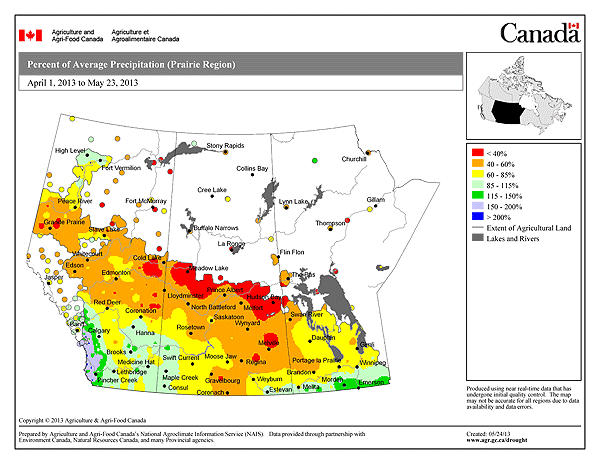
Rain was falling in Alberta and western Saskatchewan Friday. On the one hand the moisture will delay the remaining seeding work, but on the other hand it was extremely dry and crops need moisture to germinate.
Rain in Iowa and northern states over the next few days will delay seeding there. But American farmers had almost caught up with the normal seeding pace according to the weekly crop progress report that came out last Monday.
The Canadian Oilseed Processors Association said members crushed 120,619 tonnes of canola in the week ending May 22, an increase of 20 percent from the week before. That represented a capacity use of 72.5 percent.
France’s crop consultancy Agritel lowered its canola crop outlook to 4.4 million tonnes. The trade expected 4.5-4.8 million, says Reuters. Last year’s crop was 5.5 million tonnes.
Dry weather last fall at seeding, a wet winter and a cool wet spring have hurt yields in France and Britain.
The next USDA report on domestic and world grain supply and demand comes out June 12. Its seeded acreage and stocks reports are expected June 28.
A crop report from China’s ministry of agriculture said that after a slow start farmers in the northeast part of the country have mostly caught up with their corn and soybean seeding.
A highlight of the week was the round of speculation set off by comments from the U.S. Federal Reserve chairperson Ben Bernanke who said the central bank would start to wind back its stimulus bond buying program if the U.S. economy continued to post signs that it was improving. He’d said much the same time for months but market watchers seemed to read new meaning into the old words and markets rose and fell as various interpretations gained traction and then lost it.
For my two bits, it seemed much to do about nothing. The Fed’s goal is unemployment at 6.5 percent. When and if that is attained, it will start to trim its bond buying program.
Winnipeg ICE Futures Canada dollars per tonne
Canola Jul 2013 634.50 -7.90 -1.23%
Canola Nov 2013 557.50 +1.90 +0.34%
Canola Jan 2014 558.50 +1.70 +0.31%
Canola Mar 2014 553.00 +1.20 +0.22%
Canola May 2014 546.10 +1.30 +0.24%
Milling Wheat Jul 2013 294.00 unch 0.00%
Milling Wheat Oct 2013 294.00 unch 0.00%
Milling Wheat Dec 2013 294.00 unch 0.00%
Durum Wheat Jul 2013 301.90 unch 0.00%
Durum Wheat Oct 2013 294.90 unch 0.00%
Durum Wheat Dec 2013 299.40 unch 0.00%
Barley Jul 2013 244.00 unch 0.00%
Barley Oct 2013 194.00 unch 0.00%
Barley Dec 2013 199.00 unch 0.00%
American crop prices in cents US/bushel, soybean meal in $US/short ton, soy oil in cents US/pound
Chicago
Soybeans Jul 2013 1476.25 -23.25 -1.55%
Soybeans Aug 2013 1402.5 -12 -0.85%
Soybeans Sep 2013 1300 +0.5 +0.04%
Soybeans Nov 2013 1247.75 +4.75 +0.38%
Soybeans Jan 2014 1254.25 +5 +0.40%
Soybeans Mar 2014 1257.5 +4.75 +0.38%
Soybean Meal Jul 2013 428.2 -8.8 -2.01%
Soybean Meal Aug 2013 405.2 -5.4 -1.32%
Soybean Meal Sep 2013 381.9 -1.3 -0.34%
Soybean Oil Jul 2013 49.24 -0.42 -0.85%
Soybean Oil Aug 2013 49.16 -0.37 -0.75%
Soybean Oil Sep 2013 48.98 -0.33 -0.67%
Corn Jul 2013 657.25 -4.75 -0.72%
Corn Sep 2013 566.75 +3.25 +0.58%
Corn Dec 2013 536.5 +1.75 +0.33%
Corn Mar 2014 547.5 +2 +0.37%
Corn May 2014 555.25 +2 +0.36%
Oats Jul 2013 365 -5.25 -1.42%
Oats Sep 2013 356.75 -8.25 -2.26%
Oats Dec 2013 356.75 -6.75 -1.86%
Oats Mar 2014 362 -6.75 -1.83%
Oats May 2014 364.25 -6.75 -1.82%
Wheat Jul 2013 697.5 -5.75 -0.82%
Wheat Sep 2013 704.5 -5.25 -0.74%
Wheat Dec 2013 718 -5 -0.69%
Wheat Mar 2014 732.25 -5.25 -0.71%
Wheat May 2014 739.5 -4.75 -0.64%
Minneapolis
Spring Wheat Jul 2013 805.75 -7.5 -0.92%
Spring Wheat Sep 2013 799.25 -5.75 -0.71%
Spring Wheat Dec 2013 806 -5.75 -0.71%
Spring Wheat Mar 2014 818.25 -6 -0.73%
Spring Wheat May 2014 824.25 -5.5 -0.66%
Kansas City
KCBT Red Wheat Jul 2013 745.75 -8.75 -1.16%
KCBT Red Wheat Sep 2013 752.75 -8.75 -1.15%
KCBT Red Wheat Dec 2013 769.25 -9.25 -1.19%
KCBT Red Wheat Mar 2014 782 -9.5 -1.20%
KCBT Red Wheat May 2014 786.25 -9.5 -1.19%
The Bank of Canada noon rate for the loonie was 96.87 cents US, down from 96.77 on Thursday. The U.S. buck was $1.0323 Cdn.
Nearby crude oil in New York closed at $94.15 per barrel, down 10 cents.
The Toronto Stock Exchange’s S&P/TSX composite index was down 7.18 points, or 0.06 percent, at 12,650.91.
In early unofficial tallies —
The Dow Jones industrial average edged up 8.60 points, or 0.06 percent, closing at 15,303.10.
The Standard & Poor’s 500 Index dipped just 0.91 of a point, or 0.06 percent, to finish at 1,649.60.
The Nasdaq Composite Index edged down 0.27 of a point, or 0.01 percent, to close at 3,459.14.
For the week, the TSX climbed 0.3 percent, the Dow slipped 0.3 percent, while the S&P 500 and the Nasdaq each lost 1.1 percent.