

New crop canola futures edged higher Tuesday, supported by a modest increase in soy oil values.
Traders are awaiting the Statistics Canada seeded acreage survey that comes out Friday.
The survey might help get a handle on how many acres were not seeded because of excess moisture. The survey is conducted from late May to early June.
Read Also

U.S. livestock: Cattle, hogs end week on high note
Cattle contracts and nearby hog futures ended the week on a high note after a week rife with losses. Most-traded…
The Canadian dollar was slightly lower today after rallying for the past few days.
Palm oil and rapeseed oil in Europe took a breather today after rallying in recent days on the expectation that strong crude oil prices would stimulate biodiesel demand. Palm oil drifted lower as traders awaited statistics on Malaysian exports for the first 25 days of June.
November canola gained $1.30 per tonne and July slipped just 20 cents.
The weekly condition rating for U.S. corn and soybeans dipped slightly in Monday’s USDA report, but the trade expects the condition to bounce back as the forecast in the Midwest calls for less rain and more sunny days to encourage crop growth.
That kept the pressure on soybeans and corn, which both fell less than one percent.
Wheat was under pressure from the advancing harvest of U.S. winter wheat and strong competition from Black Sea and European wheat.
The U.S. Department of Agriculture said in a weekly crop report on Monday said that winter wheat harvest was 33 percent complete, despite some rain delays. That topped analyst estimates for 28 percent and the five-year average of 31 percent.
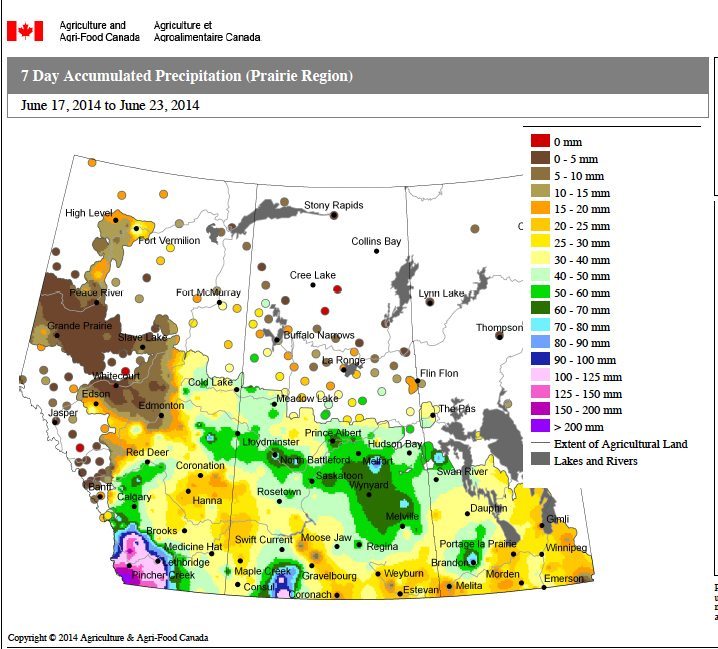
Agriculture Canada Drought Watch service, which now mostly helps to show were there is excess rain, updated its maps today.
This map of the past seven days shows the extreme moisture in southwestern Alberta. Also there were very heavy accumulations in southwestern Saskatchewan. Heavy accumulations were registered around Melfort, Wynyard and Melville and the area around Brandon, Man.
The next significant rain event on the Prairies could come Thursday, with the largest accumulation in the Swift Current to Moose Jaw region, south to the U.S. border.
Traders of American crops are starting to adjust their positions ahead of Monday’s USDA seeded acreage report.
The average of traders’ forecasts in a Reuters poll is for 91.725 million acres of corn and 82.154 million acres of soybeans, both slightly higher than in the March seeding intentions report.
Spring wheat acreage is seen at 11.86 million acres and durum wheat at 1.79 million. Spring wheat is down slightly from March and durum up a little.
Winnipeg ICE Futures Canada dollars per tonne
Canola Jul 2014 477.20 -0.20 -0.04%
Canola Nov 2014 465.70 +1.30 +0.28%
Canola Jan 2015 469.40 +1.60 +0.34%
Canola Mar 2015 470.20 +1.60 +0.34%
Canola May 2015 471.40 +2.30 +0.49%
Milling Wheat Jul 2014 197.00 -2.00 -1.01%
Milling Wheat Oct 2014 197.00 -3.00 -1.50%
Milling Wheat Dec 2014 201.00 -3.00 -1.47%
Durum Wheat Jul 2014 239.00 unch 0.00%
Durum Wheat Oct 2014 230.00 unch 0.00%
Durum Wheat Dec 2014 232.00 unch 0.00%
Barley Jul 2014 125.00 unch 0.00%
Barley Oct 2014 132.50 unch 0.00%
Barley Dec 2014 134.50 unch 0.00%
American crop prices in cents US/bushel, soybean meal in $US/short ton, soy oil in cents US/pound
Chicago
Soybeans Jul 2014 1413.5 -11.25 -0.79%
Soybeans Aug 2014 1357.75 -7.75 -0.57%
Soybeans Sep 2014 1260.75 -6.75 -0.53%
Soybeans Nov 2014 1224.5 -9.25 -0.75%
Soybeans Jan 2015 1231.25 -9.25 -0.75%
Soybeans Mar 2015 1236.75 -9.25 -0.74%
Soybean Meal Jul 2014 448.4 -7.4 -1.62%
Soybean Meal Aug 2014 433.1 -4.5 -1.03%
Soybean Meal Sep 2014 407.3 -6 -1.45%
Soybean Oil Jul 2014 40.97 +0.29 +0.71%
Soybean Oil Aug 2014 41.07 +0.29 +0.71%
Soybean Oil Sep 2014 41.14 +0.37 +0.91%
Corn Jul 2014 443 -1.5 -0.34%
Corn Sep 2014 436.75 -2.25 -0.51%
Corn Dec 2014 440.75 -1.75 -0.40%
Corn Mar 2015 451.25 -1.5 -0.33%
Corn May 2015 458.5 -1.5 -0.33%
Oats Jul 2014 339.5 +2.75 +0.82%
Oats Sep 2014 334.5 -2.5 -0.74%
Oats Dec 2014 332 -1 -0.30%
Oats Mar 2015 328.75 unch 0.00%
Oats May 2015 322.25 unch 0.00%
Wheat Jul 2014 571 -8.75 -1.51%
Wheat Sep 2014 580.75 -8.25 -1.40%
Wheat Dec 2014 602.5 -9.75 -1.59%
Wheat Mar 2015 625.25 -9.25 -1.46%
Wheat May 2015 639.25 -8 -1.24%
Minneapolis
Spring Wheat Jul 2014 676.5 -8.75 -1.28%
Spring Wheat Sep 2014 683.5 -7.5 -1.09%
Spring Wheat Dec 2014 694 -8.5 -1.21%
Spring Wheat Mar 2015 704 -7.5 -1.05%
Spring Wheat May 2015 710.75 -5.25 -0.73%
Kansas City
KC HRW Wheat Jul 2014 705.5 -8.5 -1.19%
KC HRW Wheat Sep 2014 703.75 -9 -1.26%
KC HRW Wheat Dec 2014 710.75 -9.5 -1.32%
KC HRW Wheat Mar 2015 714 -9.5 -1.31%
KC HRW Wheat May 2015 711.25 -9.75 -1.35%
Light crude oil nearby futures in New York dropped 14 cents at $106.03 US per barrel.
The Canadian dollar at noon was 93.11 cents US, down from 93.19 cents the previous trading day. The U.S. dollar at noon was $1.0740 Cdn.
U.S. consumer confidence surged more than expected in June, and new home sales in May rose more than anticipated, but that was not enough to drive stock markets higher as traders worried about the crisis in Iraq.
In early, unofficial tallies —
The TSX composite closed down 143.25 points or 0.95 percent at 14,962.37.
The Dow Jones industrial average fell 119.13 points or 0.70 percent, to end at 16,818.13.
The S&P 500 lost 12.63 points or 0.64 percent, to finish at 1,950.01.
The Nasdaq Composite dropped 18.32 points or 0.42 percent, to close at 4,350.36.


