
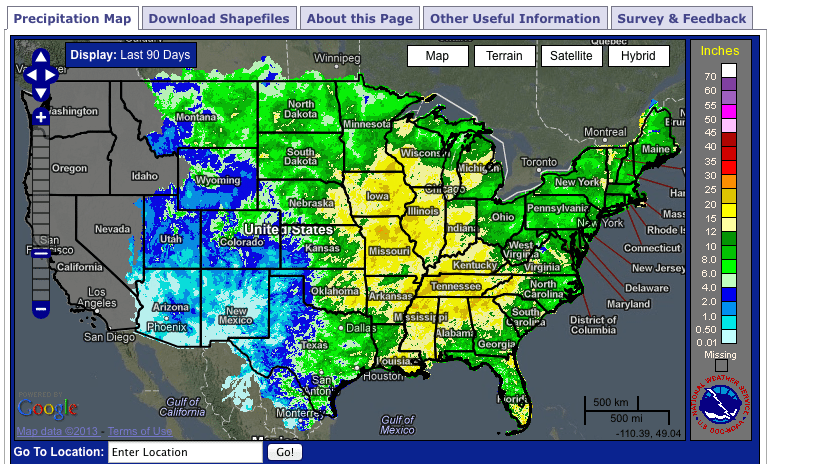
Worries about rain delays and, in some areas, saturated fields in the Midwest and North Dakota lifted U.S. crop markets Friday, but canola futures fell on profit taking.
A lot of the volume in the canola trade was rolling out of July and into November.
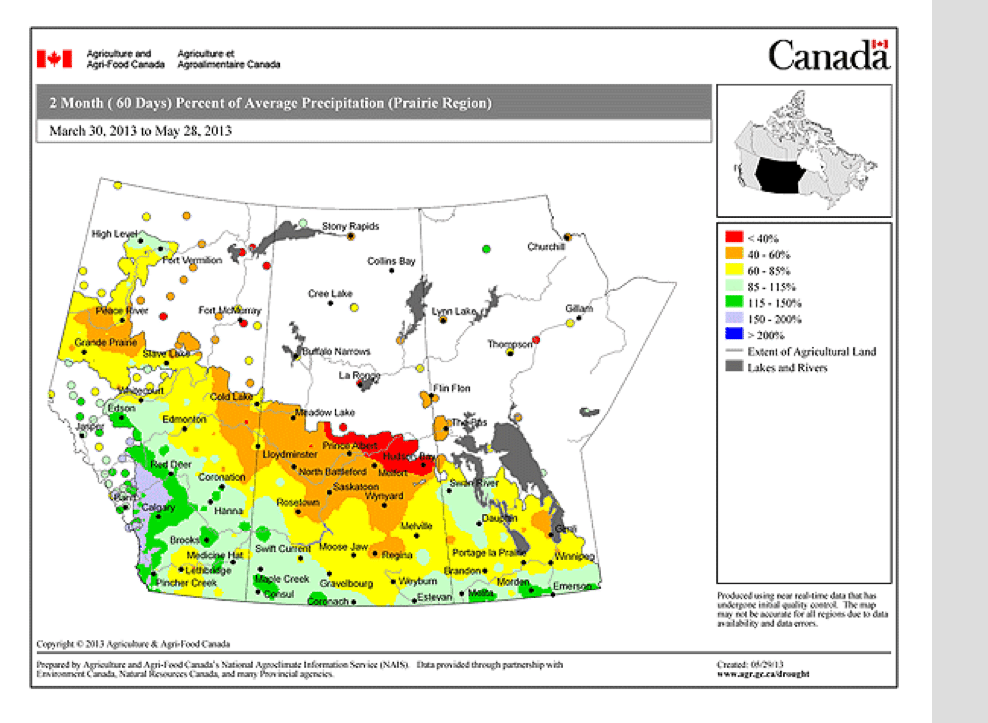
Pressure also came as Prairie farmers start to wrap up this year’s seeding campaign.
Rain that was forecast for Saskatchewan on Sunday-Monday is now mostly gone from the forecast. Rain this week was mostly north of Calgary and south of the TransCanada in Saskatchewan.
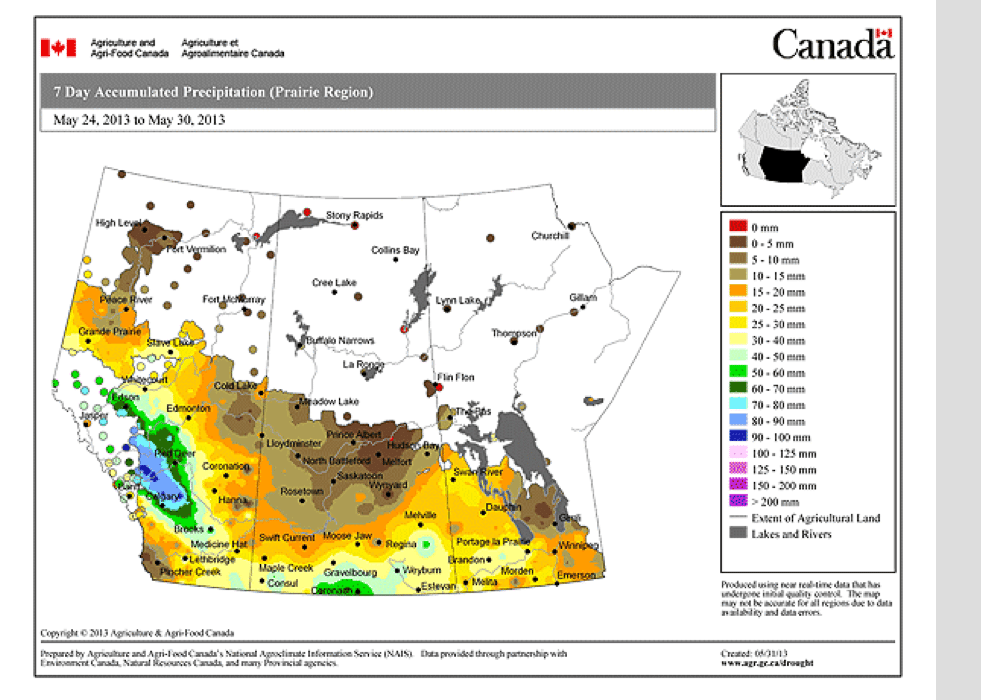
Northern parts of grain belt have had little rain this spring.
While the canola market edged lower today it was a good week for the oilseed.
July canola ended at 642.30, up $7.80 and new crop November closed at $572.50, up $15 per tonne from the close the previous Friday.
The rain in the U.S. could lead to some prevented planting. There is more soybean than corn left to seed in the U.S. but with the lateness of the season some
acres that were tagged for other crops might now go into soybeans because of their shorter growing season and the fact that farmers prefer not to have corn setting yield in the hottest part of summer.
The key corn and soybean state, Iowa, had the wettest spring (March through May) in the 141 years of record keeping. On average, the state received about 17.5 inches of rain. A typical spring sees a little more than 10 inches.

Reuters did a poll of analysts who watch Black Sea crops.
The average of estimates for Russia’s wheat production is 54 million tonnes (56 latest USDA forecast) and exports at 15.4 million tonnes (22 million USDA).
The average of estimates for Ukraine’s wheat production is 20.5 million tonnes (18 million latest USDA forecast) and exports at 8.6 million tonnes (9.5 million USDA).
The average of estimates for Kazakhstan wheat production is 14.8 million tonnes (15 million latest USDA forecast) and exports at 6.9 million tonnes (7.5 million USDA).
So generally speaking, analysts think exports from the Black Sea region, though up from 2012-13, will be less than USDA’s prediction.
South Korea has suspended imports of U.S. wheat imports over the discovery of a non-approved GMO variety of soft white wheat in an Oregon field. However, wheat futures edged higher today, pulled up by rising corn. Other Asian importers have stepped up testing of U.S. wheat over the issue.
Read Also

U.S. livestock: Cattle slip back, hogs gain
Chicago cattle futures slipped back on Friday after Thursday’s pause. Hog futures crept upward. Most-active December live cattle futures closed…
The Canadian Oilseed Processors Association said members crushed 97,805 tonnes of canola in the week ending May 29, down about 19 percent, representing a capacity use of only about 59 percent, down from the average to date of about 85.4 percent.
Winnipeg ICE Futures Canada dollars per tonne
Canola Jul 2013 642.30 -3.20 -0.50%
Canola Nov 2013 572.50 -1.20 -0.21%
Canola Jan 2014 573.00 -1.90 -0.33%
Canola Mar 2014 568.00 -1.20 -0.21%
Canola May 2014 559.80 -1.20 -0.21%
Milling Wheat Jul 2013 294.00 unch 0.00%
Milling Wheat Oct 2013 294.00 unch 0.00%
Milling Wheat Dec 2013 294.00 unch 0.00%
Durum Wheat Jul 2013 301.90 unch 0.00%
Durum Wheat Oct 2013 294.90 unch 0.00%
Durum Wheat Dec 2013 299.40 unch 0.00%
Barley Jul 2013 244.00 unch 0.00%
Barley Oct 2013 194.00 unch 0.00%
Barley Dec 2013 199.00 unch 0.00%
American crop prices in cents US/bushel, soybean meal in $US/short ton, soy oil in cents US/pound
Chicago
Soybeans Jul 2013 1510 +14.25 +0.95%
Soybeans Aug 2013 1437.75 +11 +0.77%
Soybeans Sep 2013 1347.25 +13 +0.97%
Soybeans Nov 2013 1304.25 +15 +1.16%
Soybeans Jan 2014 1310 +15.5 +1.20%
Soybeans Mar 2014 1310.25 +15.25 +1.18%
Soybean Meal Jul 2013 447.2 +6.4 +1.45%
Soybean Meal Aug 2013 425.8 +5.5 +1.31%
Soybean Meal Sep 2013 406 +6.6 +1.65%
Soybean Oil Jul 2013 48.38 -0.2 -0.41%
Soybean Oil Aug 2013 48.38 -0.19 -0.39%
Soybean Oil Sep 2013 48.21 -0.23 -0.47%
Corn Jul 2013 662 +7.75 +1.18%
Corn Sep 2013 597.25 +5.5 +0.93%
Corn Dec 2013 567.25 +4.5 +0.80%
Corn Mar 2014 577 +4.25 +0.74%
Corn May 2014 582.75 +3.25 +0.56%
Oats Jul 2013 374.25 +6.25 +1.70%
Oats Sep 2013 370.25 +4.25 +1.16%
Oats Dec 2013 363.5 +4.5 +1.25%
Oats Mar 2014 367.25 +4.25 +1.17%
Oats May 2014 369.5 +4.25 +1.16%
Wheat Jul 2013 705.5 +6.75 +0.97%
Wheat Sep 2013 715.5 +7.5 +1.06%
Wheat Dec 2013 730 +6.5 +0.90%
Wheat Mar 2014 744.5 +5.75 +0.78%
Wheat May 2014 754 +6 +0.80%
Minneapolis
Spring Wheat Jul 2013 820 +4.5 +0.55%
Spring Wheat Sep 2013 808.25 +3 +0.37%
Spring Wheat Dec 2013 815.5 +2.75 +0.34%
Spring Wheat Mar 2014 827.5 +2.5 +0.30%
Spring Wheat May 2014 836.5 +5.25 +0.63%
Kansas City
KCBT Red Wheat Jul 2013 751 +5 +0.67%
KCBT Red Wheat Sep 2013 760 +4.75 +0.63%
KCBT Red Wheat Dec 2013 778.75 +4.75 +0.61%
KCBT Red Wheat Mar 2014 792.5 +5 +0.63%
KCBT Red Wheat May 2014 800.25 +6 +0.76%
Light crude oil nearby futures in New York down $1.64 at $91.97 US per barrel.
The Canadian dollar at noon was 96.72 cents US, down from 97 cents the previous trading day. The U.S. dollar at noon was $1.0339 Cdn.
There was mixed global economic data
Canada’s gross domestic product grew at an annualized 2.5 percent in the first quarter, the fastest pace in six quarters.
Unemployment reached a new high in the euro zone and inflation remained well below the European Central Bank’s target. U.S. consumer spending fell in April for the first time in almost a year and inflation pressures were subdued, Reuters reported
On the other hand, a reading on consumer sentiment from Thomson Reuters and the University of Michigan came in at 84.5 in late May, up from 83.7 earlier in the month, and besting economists’ expectations that it would hold steady. The gauge is now at its highest level since July 2007.
In early unofficial data —
The Toronto Stock Exchange composite closed at 12,650.42, down 96.14 points or 0.75 percent
The Dow Jones industrial average tumbled 208.96 points, or 1.36 percent, to end at 15,115.57.
The Standard & Poor’s 500 Index fell 23.67 points, or 1.43 percent, to finish at 1,630.74.
The Nasdaq Composite Index slid 35.38 points, or 1.01 percent, to close at 3,455.91.
The S&P 500 rose 14.34 percent for the first five months of 2013 – its best first five months since 1997.
In May the Dow and S&P 500 each climbed close to three percent, while the Nasdaq soared close to five percent.


