ICE Canada canola futures closed slightly lower Thursday, weighed down by a firm loonie, a dip in soybeans and other oilseeds and some commercial hedging ahead of what is expected to be a big harvest.
The loonie rose mainly because the U.S. buck fell against most currencies as traders interpreted minutes of the most recent meeting of the Federal Reserve that were released Wednesday. Traders who thought the Fed would raise rates this fall were disappointed that comments from Fed members were not so hawkish. It might be winter before rates rise.
Read Also

Draft ‘MAHA’ commission report avoids pesticide crackdown feared by farm groups
The White House will not impose new guardrails on the farm industry’s use of pesticides as part of a strategy to address children’s health outcomes, according to a draft obtained by Reuters of a widely anticipated report from President Donald Trump’s ‘Make America Healthy Again’ commission.
Early in the day canola traded higher on talk of export demand.
Saskatchewan Agriculture’s crop report today forecast provincial average canola yield at 37 bushels an acre, close to last year’s 36.5 bu.
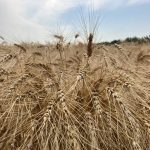
It forecast spring wheat at 43 bu. an acre up from last year’s 39.2 bu.
Click here to see a table with all the yield forecasts.
The report said that three percent of the province’s crops were in the bin, about equal to the five-year average.
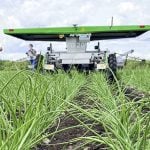
About nine percent of the canola has been swathed.
The seven-day rain outlook from the U.S. Weather Service continues to show mostly dry conditions over the Canadian Prairies, which would be beneficial for harvest progress.
That does not rule out local showers, but there are no major rain systems.
Temperatures through the rest of August could average a little cooler than normal, although there will hot days.
Early September though could average a little warmer than normal.
Soybeans generally were mixed with November closing slightly lower, but up from the lows of the day.
Corn closed higher for a fifth day on technical factors but the expectation of a record U.S. crop limited the gain.
Technical trade also pushed wheat futures up a few pennies, but the expectation of a big North American harvest and cutthroat trade limited gains.
Soyoil futures closed higher, their seventh straight day of gains, after showing weakness early in the day. Strength in crude oil prices helped pull soyoil higher even though palm oil dipped.
Palm oil has been on a tear recently on smaller than expected production and good demand. The El Nino caused drought in Indonesia and Malaysia that is still limiting production.
Technicians noted that CBOT September soyoil, which has rallied 10.8 percent during the winning streak, failed to break through Wednesday’s high.
The U.S. agriculture department reported weekly old-crop soybean export sales of 177,900 tonnes and new-crop export sales of 1.598 million tonnes, both in line with market expectations.
Old-crop corn export sales totaled 167,400 tonnes, below market forecasts. New-crop corn export sales were 1.043 million tonnes, in line with trade expectations.
Wheat export sales were 489,500 tonnes, in line with a range of analysts’ forecasts.
Crude oil rallied strongly on the hope that when OPEC members meet in Algeria as an energy forum next month they will revive talks about freezing production. Such discussions failed earlier this year.
Light crude oil nearby futures in New York jumped $1.43 to US$48.22 per barrel.
The Canadian dollar at noon was US78.28 cents, up from 77.61 cents the previous trading day. The U.S. dollar at noon was C$1.2775
The TSX composite fell just 1.92 points or 0.01 percent to 14,695.68.
The Dow Jones industrial average rose 23.76 points, or 0.13 percent, to 18,597.7, the S&P 500 gained 4.8 points, or 0.22 percent, to 2,187.02 and the Nasdaq Composite added 11.49 points, or 0.22 percent, to 5,240.15.
Winnipeg ICE Futures Canada dollars per tonne
Canola Nov 16 468.50s -0.40 -0.09%
Canola Jan 17 475.10s -0.60 -0.13%
Canola Mar 17 480.90s -0.70 -0.15%
Canola May 17 485.40s -1.10 -0.23%
Canola Jul 17 488.90s -1.70 -0.35%
Milling Wheat Oct 16 219.00s +3.00 +1.39%
Milling Wheat Dec 16 221.00s +3.00 +1.38%
Milling Wheat Mar 17 225.00s +4.00 +1.81%
Durum Wheat Oct 16 261.00s -1.00 -0.38%
Durum Wheat Dec 16 264.00s -1.00 -0.38%
Durum Wheat Mar 17 269.00s unch unch
Barley Oct 16 138.00s unch unch
Barley Dec 16 138.00s unch unch
Barley Mar 17 140.00s unch unc
American crop prices in cents US/bushel, soybean meal in $US/short ton, soy oil in cents US/pound
Chicago
Soybeans Sep 2016 1032.25 +1.75 +0.17%
Soybeans Nov 2016 1014.50 -1.50 -0.15%
Soybeans Jan 2017 1014.50 -1.00 -0.10%
Soybeans Mar 2017 1007.75 +0.50 +0.05%
Soybeans May 2017 1003.50 +0.75 +0.07%
Soybeans Jul 2017 1002.25 +0.25 +0.02%
Soybean Meal Sep 2016 334.40 -2.30 -0.68%
Soybean Meal Oct 2016 332.50 -1.80 -0.54%
Soybean Meal Dec 2016 331.20 -1.20 -0.36%
Soybean Oil Sep 2016 34.19 +0.18 +0.53%
Soybean Oil Oct 2016 34.33 +0.17 +0.50%
Soybean Oil Dec 2016 34.61 +0.17 +0.49%
Corn Sep 2016 332.00 +1.75 +0.53%
Corn Dec 2016 342.00 +2.25 +0.66%
Corn Mar 2017 351.75 +2.00 +0.57%
Corn May 2017 358.75 +2.75 +0.77%
Corn Jul 2017 365.50 +2.75 +0.76%
Oats Sep 2016 170.00 -0.50 -0.29%
Oats Dec 2016 183.75 -2.00 -1.08%
Oats Mar 2017 194.50 -3.00 -1.52%
Oats May 2017 198.25 -2.25 -1.12%
Oats Jul 2017 204.75 -2.50 -1.21%
Wheat Sep 2016 427.00 +1.00 +0.23%
Wheat Dec 2016 444.25 +1.25 +0.28%
Wheat Mar 2017 462.50 +1.25 +0.27%
Wheat May 2017 474.75 +1.25 +0.26%
Wheat Jul 2017 483.00 +1.25 +0.26%
Minneapolis
Spring Wheat Sep 2016 527.75 +3.50 +0.67%
Spring Wheat Dec 2016 526.00 +2.00 +0.38%
Spring Wheat Mar 2017 534.75 +1.50 +0.28%
Spring Wheat May 2017 541.75 +0.50 +0.09%
Spring Wheat Jul 2017 550.00 unch 0.00%
Kansas
Hard Red Wheat Sep 2016 421.00 +2.75 +0.66%
Hard Red Wheat Dec 2016 446.75 +2.75 +0.62%
Hard Red Wheat Mar 2017 462.25 +2.75 +0.60%
Hard Red Wheat May 2017 472.25 +2.50 +0.53%
Hard Red Wheat Jul 2017 481.50 +2.50 +0.52%
Chicago livestock futures in US¢/pound (rounded to two decimal places)
Live Cattle (P) Aug 2016 113.58 -1.17 -1.02%
Live Cattle (P) Oct 2016 110.58 -1.82 -1.62%
Live Cattle (P) Dec 2016 112.05 -1.55 -1.36%
Feeder Cattle (P) Aug 2016 145.02 -1.70 -1.16%
Feeder Cattle (P) Sep 2016 143.15 -1.78 -1.23%
Feeder Cattle (P) Oct 2016 140.62 -1.81 -1.27%
Lean Hogs (P) Oct 2016 60.70 -0.30 -0.49%
Lean Hogs (P) Dec 2016 56.45 -0.30 -0.53%
Lean Hogs (P) Feb 2017 61.05 -0.33 -0.54%