New crop canola fell on Wednesday, pressured by mostly favourable growing weather on the Prairies and U.S. Midwest.
Statistics Canada seeded acreage report yesterday pegged canola area at 19.74 million acres, up from the 19.13 forecast in the spring seeding intentions report released in April.
Wheat area is up from last year but not as high as was expected in the spring seeding intentions report.
StatsCan said lentil area would be down 2.4 percent from last year but that was less of a decline than had been expected in the seeding intentions report, which saw a 13 percent decline.
Read Also

U.S. livestock: Hog futures hit contract highs on shock herd decline
Chicago | Reuters – Lean hog futures stormed to contract highs at the Chicago Mercantile Exchange on Friday as smaller-than-expected…
Canola was also under pressure from an uptick in crop deliveries and from a generally weak vegetable oil market, pressured by surplus current stocks of soy oil and palm oil.
Old crop canola, soybeans and corn all closed higher on extremely tight grain stocks.
Traders were adjusting positions ahead of the USDA acreage and stocks report due Friday.
Landworth, a company that tracks crops with satellite technology, today estimated the U.S. soybean crop area at 78 million acres, up 850,000 acres from the current USDA forecast.
In a Reuters poll of 21 analysts, the average estimate for corn acreage was 95.3 million (USDA 97.3 million), while soybean acreage was seen at 77.9 million (USDA 77.1 million). The poll estimated spring wheat acreage at 12.1 million.
The average forecast for corn stocks was 2.845 billion bushels. The average soybean forecast was 442 million bu.
Winnipeg ICE Futures Canada dollars per tonne
Canola Jul 2013 613.10 +5.10 +0.84%
Canola Nov 2013 543.90 -10.50 -1.89%
Canola Jan 2014 548.50 -10.50 -1.88%
Canola Mar 2014 548.20 -9.50 -1.70%
Canola May 2014 545.90 -9.10 -1.64%
Milling Wheat Jul 2013 294.00 unch 0.00%
Milling Wheat Oct 2013 294.00 unch 0.00%
Milling Wheat Dec 2013 294.00 unch 0.00%
Durum Wheat Jul 2013 301.90 unch 0.00%
Durum Wheat Oct 2013 294.90 unch 0.00%
Durum Wheat Dec 2013 299.40 unch 0.00%
Barley Jul 2013 244.00 unch 0.00%
Barley Oct 2013 194.00 unch 0.00%
Barley Dec 2013 199.00 unch 0.00%
American crop prices in cents US/bushel, soybean meal in $US/short ton, soy oil in cents US/pound
Chicago
Soybeans Jul 2013 1534.25 +9 +0.59%
Soybeans Aug 2013 1425.25 -4 -0.28%
Soybeans Sep 2013 1317 -6.5 -0.49%
Soybeans Nov 2013 1276 -2.5 -0.20%
Soybeans Jan 2014 1279 -2.75 -0.21%
Soybeans Mar 2014 1274.75 -4 -0.31%
Soybean Meal Jul 2013 463.3 +4.5 +0.98%
Soybean Meal Aug 2013 430.8 +2.7 +0.63%
Soybean Meal Sep 2013 404.3 -0.2 -0.05%
Soybean Oil Jul 2013 46.63 -0.51 -1.08%
Soybean Oil Aug 2013 46.62 -0.51 -1.08%
Soybean Oil Sep 2013 46.25 -0.53 -1.13%
Corn Jul 2013 664.5 +7.75 +1.18%
Corn Sep 2013 574 -2.5 -0.43%
Corn Dec 2013 544 -0.5 -0.09%
Corn Mar 2014 554.25 -0.75 -0.14%
Corn May 2014 561.25 -0.75 -0.13%
Oats Jul 2013 383.75 -3.5 -0.90%
Oats Sep 2013 374.75 -0.75 -0.20%
Oats Dec 2013 370.5 -1.25 -0.34%
Oats Mar 2014 373.75 -1 -0.27%
Oats May 2014 376 -1 -0.27%
Wheat Jul 2013 667 -8.75 -1.29%
Wheat Sep 2013 677 -8 -1.17%
Wheat Dec 2013 692.25 -7.25 -1.04%
Wheat Mar 2014 706.5 -7.25 -1.02%
Wheat May 2014 716 -6.75 -0.93%
Minneapolis
Spring Wheat Jul 2013 799 -10.25 -1.27%
Spring Wheat Sep 2013 782.5 +0.25 +0.03%
Spring Wheat Dec 2013 790.25 -0.75 -0.09%
Spring Wheat Mar 2014 803.5 -0.75 -0.09%
Spring Wheat May 2014 809 -1.75 -0.22%
Kansas City
KCBT Red Wheat Jul 2013 694.25 -10 -1.42%
KCBT Red Wheat Sep 2013 706 -7.25 -1.02%
KCBT Red Wheat Dec 2013 727 -5 -0.68%
KCBT Red Wheat Mar 2014 741.75 -4.5 -0.60%
KCBT Red Wheat May 2014 750.5 -3.75 -0.50%
Light crude oil nearby futures in New York rose 18 cents at $95.50 US per barrel.
The Canadian dollar at noon was 95.52 cents US, up from 95.12 cents the previous trading day. The U.S. dollar at noon was $1.0469 Cdn.
The TSX composite was trading a little lower going into the close, pressured by word that Verizon, a big U.S. telecom player, is planning to move into the Canadian market by buying Wind Mobile. Also bullion prices fell, pressuring gold miner shares. Bullion is falling as a safe haven as U.S. bond yields and dollar strengthen.
U.S. stocks markets were buoyed today by another installment of the “bad news is good news” phenomena. The U.S. commerce department said the American economy in the first quarter grew at an annualized rate of 1.8 percent, well below expectations of 2.4 percent.
This reduced the likelihood of the Federal Reserve tightening its monetary policy and that helped stocks post strong gains.
Yesterday, stronger than expected readings of U.S. economic activity led stocks to rise.
In early unofficial tallies —
The Toronto Stock Exchange’s S&P/TSX composite index fell 41.41 points, or 0.34 percent, at 11,964.01, although six of the 10 main sectors on the index were higher.
The Dow Jones industrial average rose 149.83 points or 1.02 percent, to end at 14,910.14.
The S&P 500 gained 15.23 points or 0.96 percent, to finish at 1,603.26.
The Nasdaq Composite climbed 28.34 points or 0.85 percent, to close at 3,376.22.
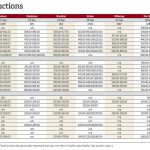
Click on the table to see the full StatsCan acreage report.


