Canola was dragged down on Tuesday by falling soybeans and soy oil following the weekly USDA crop condition report that showed soy conditions did not decline as expected.
Investors continued on edge over the potential for economic slowdown in China and the emergency euro zone summit called to address Greece’s debt repayment crisis.
Falling crude oil prices early in the day weighed on soy oil, but crude recovered in the afternoon.
The U.S. dollar rose, weighing down U.S. crop markets. A stronger U.S. currency weakens international demand for commodities priced in U.S. dollars.
Read Also

U.S. livestock: Cattle, hogs end week on high note
Cattle contracts and nearby hog futures ended the week on a high note after a week rife with losses. Most-traded…
November soybeans were down 2.86 percent and July soy oil was down 3.77 percent/
The forecast for an increased potential for rain in Saskatchewan this coming weekend also weighed on canola.
However the forecast also calls for temperatures to rise into the low 30s C.
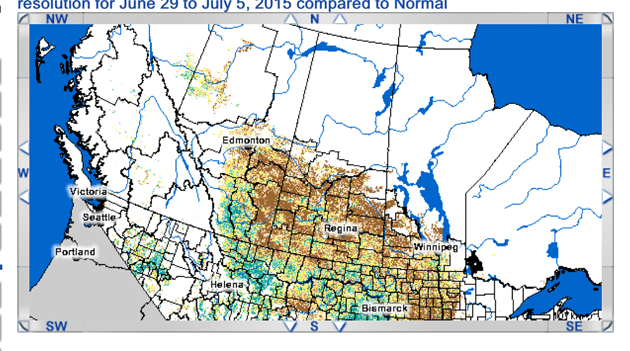
In the map above, brown is worse than normal, yellow is normal and green is better than normal.
American analysts had expected the heavy rain last week in the Midwest would lead to U.S. crop downgrades in the weekly USDA crop condition report, but that did not happen.
The department on Monday rated the corn crop as 69 percent good to excellent, up one point from a week earlier, and ahead of market forecasts.
The soybean crop rating was steady at 63 percent good to excellent, which was above analysts’ estimates.
“Crops are not getting worse,” Karl Setzer, risk management team leader at MaxYield Co-operative in Iowa, told Reuters. “Where crops are good they are getting better.”
The French farm ministry put its first estimate for this year’s soft wheat crop at 37.9 million tonnes, up one percent on 2014, as a fall in yields would nearly offset the larger area sown.
The estimate was above trade expectations of 36.5-37 million tonnes, Reuters reported.
It noted that the lack of rain and the heat at the start of summer could hit the potential of certain crops.
June average temperature was 1.5 degree C more than the seasonal average, according to weather forecaster Meteo France.
Over the same period rainfall was below normal in the entire country with particularly low levels in the north.
Temperatures recently have fallen from record highs but there is little rain in sight and 21 departments (counties) out of 96 in mainland France already have water restrictions in some area.
The Indan monsoon has shifted into a drier trend. After above expected rain in June the Indian meterological department expects a below normal July.
With the recent dry period, on a cumulative basis, the country’s rain average is now steady with the expectation, down from a strong surplus in June.
Light crude oil nearby futures in New York were down 20 cents to US$52.33 per barrel.
The Canadian dollar at noon was US78.49 cents, down from 79.20 cents the previous trading day. The U.S. dollar at noon was C$1.2740.
Canada’s main stock index staged a dramatic recovery to end in positive territory on Tuesday, with energy stocks cheered by oil’s paring of losses and utilities gaining on increased bets that the Bank of Canada could cut interest rates.
The Toronto Stock Exchange’s S&P/TSX composite index closed up 30.93 points, or 0.21 percent, at 14,624.50. It had fallen as low as 14,389.10.
The Dow Jones industrial average rose 95.94 points, or 0.54 percent, to 17,779.52, the S&P 500 gained 12.84 points, or 0.62 percent, to 2,081.6 and the Nasdaq Composite added 5.52 points, or 0.11 percent, to 4,997.46.
Winnipeg ICE Futures Canada dollars per tonne
Canola Jul 2015 532.10 -10.40 -1.92%
Canola Nov 2015 523.90 -8.30 -1.56%
Canola Jan 2016 523.70 -9.00 -1.69%
Canola Mar 2016 522.00 -12.10 -2.27%
Canola May 2016 518.20 -12.20 -2.30%
Milling Wheat Jul 2015 250.00 -2.00 -0.79%
Milling Wheat Oct 2015 247.00 -3.00 -1.20%
Milling Wheat Dec 2015 247.00 -3.00 -1.20%
Durum Wheat Jul 2015 298.00 unch 0.00%
Durum Wheat Oct 2015 298.00 unch 0.00%
Durum Wheat Dec 2015 303.00 unch 0.00%
Barley Jul 2015 212.40 unch 0.00%
Barley Oct 2015 207.40 unch 0.00%
Barley Dec 2015 212.40 unch 0.00%
American crop prices in cents US/bushel, soybean meal in $US/short ton, soy oil in cents US/pound
Chicago
Soybeans Jul 2015 1002 -31.75 -3.07%
Soybeans Aug 2015 992 -30.25 -2.96%
Soybeans Sep 2015 985.25 -30.25 -2.98%
Soybeans Nov 2015 985.75 -29 -2.86%
Soybeans Mar 2016 989.75 -28.25 -2.78%
Soybean Meal Jul 2015 349.9 -4.5 -1.27%
Soybean Meal Aug 2015 342.5 -3.8 -1.10%
Soybean Meal Sep 2015 338.1 -4.3 -1.26%
Soybean Oil Jul 2015 31.41 -1.23 -3.77%
Soybean Oil Aug 2015 31.52 -1.22 -3.73%
Soybean Oil Sep 2015 31.57 -1.23 -3.75%
Corn Jul 2015 415.75 -2.75 -0.66%
Corn Sep 2015 423.25 -3.25 -0.76%
Corn Dec 2015 433 -2 -0.46%
Corn Mar 2016 442.75 -1.75 -0.39%
Corn May 2016 448.25 -2 -0.44%
Oats Jul 2015 251.25 -1.25 -0.50%
Oats Sep 2015 260.5 -1.25 -0.48%
Oats Dec 2015 271.75 -2.5 -0.91%
Oats Mar 2016 280.75 -2.25 -0.80%
Oats May 2016 280.75 -2.25 -0.80%
Wheat Jul 2015 579.5 -9 -1.53%
Wheat Sep 2015 585.25 -10.25 -1.72%
Wheat Dec 2015 592.75 -11 -1.82%
Wheat Mar 2016 600.25 -11.75 -1.92%
Wheat May 2016 604.25 -12.5 -2.03%
Minneapolis
Spring Wheat Jul 2015 609.75 -9 -1.45%
Spring Wheat Sep 2015 623.5 -6.5 -1.03%
Spring Wheat Dec 2015 638 -7.25 -1.12%
Spring Wheat Mar 2016 648.75 -5.5 -0.84%
Spring Wheat May 2016 654 -6.75 -1.02%
Kansas City
Hard Red Wheat Jul 2015 570.75 -5.5 -0.95%
Hard Red Wheat Sep 2015 586.25 -5 -0.85%
Hard Red Wheat Dec 2015 606.5 -5 -0.82%
Hard Red Wheat Mar 2016 619.5 -3.25 -0.52%
Hard Red Wheat May 2016 626.75 -4 -0.63%