

The first partial week of August ended with canola up for a third day after bottoming its recent descent on July 30 and 31.
Friday’s slight rise of $4.23 per tonne to $493.60 on the Winnipeg November futures contract brought the contract $11 up from its recent low. November fell $3.30 on the week.
With the contract falling about $50 during July, this short-term rally isn’t impressing many yet as a turnaround.
“Some people feel the recent selloff has been overdone,” said a trader after the Friday close.
Read Also
Prairie Wheat Weekly Spring wheat prices decline
Western Canadian spring wheat prices were mostly lower, while those for durum were relatively steady during the week ended Aug. 14, 2025.
“This corrected a bit of that.”
Canola got strength from relative strength in soybean oil, which fell only slightly Friday versus a bigger selloff in soybeans, and by a decline in the value of the loonie.
December wheat closed slightly higher on the Chicago and Kansas City exchanges. Spring wheat was little changed.
Rains seen replenishing dry soil in parts of top U.S. soy producer Iowa and neighboring areas, boosting crop prospects.
Here is the U.S. weather service’s five day accumulated rainfall outlook as of Friday afternoon.
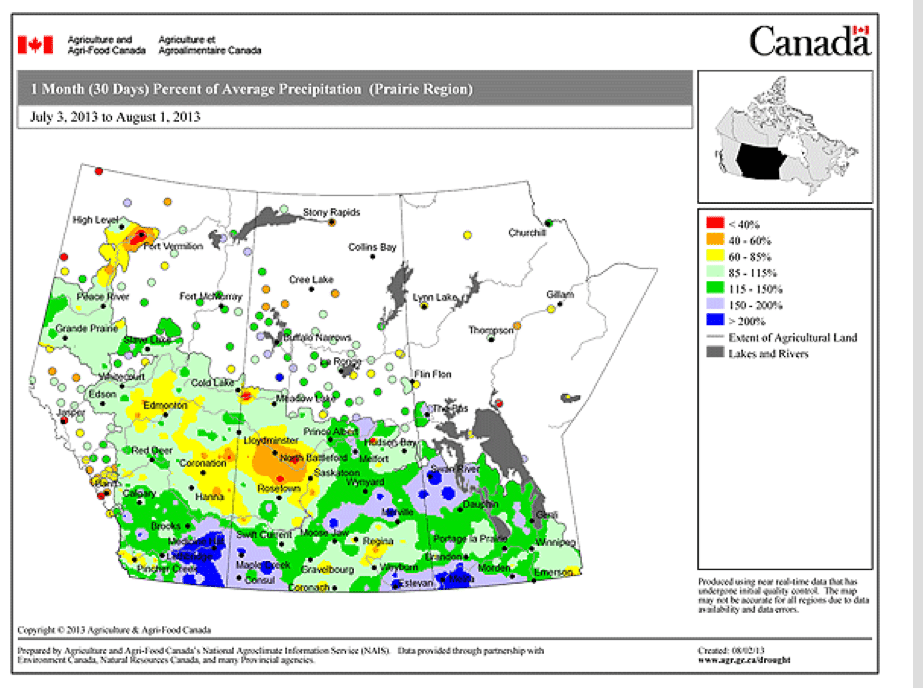
Click on map for percent of average precipitation July 3-Aug. 1 for the Prairies.
Crop markets are generally weak because of big crops developing across most of the Western Hemisphere and in Europe. Supply fears are diminishing, with only the potential for frost damage in August or September presenting a possibility for disappointing production.
Reuters reported Doane Advisory Services on Friday forecast U.S. 2013 corn production at 14.269 billion bushels with an average yield of 161.2 bu. per acre, following its annual crop tour.
The St. Louis-based firm’s estimates are above the U.S. Department of Agriculture’s current forecast: a record-large corn crop of 13.950 billion bu. with a yield of 156.5 bu. per acre, Reuters said.
Doane projected the U.S. 2013 soybean crop at 3.333 billion bu., with an average yield of 43.2 bu. per acre.
Those figures fall below the USDA’s forecast for a record soybean harvest totaling 3.420 billion bu., with a yield of 44.5 bu. per acre, Reuters said.
Traders say China plans to auction 500,000 tonnes of soybeans from its reserves next week, but the price is expected to be too high to generate much interest from domestic buyers.
Industry group Abiove said Brazil is forecast to export a record 39.5 million tonnes of soybeans in 2013-14 (February-January) commercial year, up 1.3 percent from a mid-July forecast, Reuters reported.
Commodity markets were generally stronger Friday, but grains were one of the two classes that fell.
Stock markets were becalmed, grappling with various earnings reports and a U.S. jobs report that was a little bit good and a little bit bad.
The U.S. economy is slightly adding jobs, but those are part-time jobs and there is no growth in full-time jobs. This has caused many to describe the U.S. economic situation as “tepid.”
The Canadian Oilseed Processors Association said members crushed 97,698 tonnes of canola in the week ending July 31, down about 17 percent from the week before. That represented a capacity use of only about 59 percent.
Winnipeg ICE Futures Canada dollars per tonne
Canola Nov 2013 493.60 +4.20 +0.86%
Canola Jan 2014 497.40 +4.30 +0.87%
Canola Mar 2014 502.20 +4.70 +0.94%
Canola May 2014 504.90 +4.40 +0.88%
Canola Jul 2014 507.50 +4.10 +0.81%
Milling Wheat Oct 2013 257.00 +3.00 +1.18%
Milling Wheat Dec 2013 260.00 +3.00 +1.17%
Milling Wheat Mar 2014 267.00 +3.00 +1.14%
Durum Wheat Oct 2013 296.00 +3.00 +1.02%
Durum Wheat Dec 2013 300.00 +3.00 +1.01%
Durum Wheat Mar 2014 310.00 +3.00 +0.98%
Barley Oct 2013 189.00 unch 0.00%
Barley Dec 2013 194.00 unch 0.00%
Barley Mar 2014 194.00 unch 0.00%
American crop prices in cents US/bushel, soybean meal in $US/short ton, soy oil in cents US/pound
Chicago
Soybeans Aug 2013 1331 -26.75 -1.97%
Soybeans Sep 2013 1212.75 -21.5 -1.74%
Soybeans Nov 2013 1181.5 -11 -0.92%
Soybeans Jan 2014 1187.25 -10.75 -0.90%
Soybeans Mar 2014 1190 -10.75 -0.90%
Soybeans May 2014 1190.5 -10.25 -0.85%
Soybean Meal Aug 2013 412.1 -13.3 -3.13%
Soybean Meal Sep 2013 385.2 -12.5 -3.14%
Soybean Meal Oct 2013 357.2 -5.6 -1.54%
Soybean Oil Aug 2013 42.38 -0.11 -0.26%
Soybean Oil Sep 2013 42.49 -0.11 -0.26%
Soybean Oil Oct 2013 42.6 -0.08 -0.19%
Corn Sep 2013 476 -11.5 -2.36%
Corn Dec 2013 463.75 -3.25 -0.70%
Corn Mar 2014 476.5 -3.25 -0.68%
Corn May 2014 484.25 -3.25 -0.67%
Corn Jul 2014 490.25 -3 -0.61%
Oats Sep 2013 338.75 -1 -0.29%
Oats Dec 2013 326.5 -3 -0.91%
Oats Mar 2014 332.5 -2 -0.60%
Oats May 2014 332.75 -2 -0.60%
Oats Jul 2014 337.75 -2 -0.59%
Wheat Sep 2013 660.5 +2.5 +0.38%
Wheat Dec 2013 673 +2.5 +0.37%
Wheat Mar 2014 682.5 +1.5 +0.22%
Wheat May 2014 687.5 +0.5 +0.07%
Wheat Jul 2014 682 -0.75 -0.11%
Minneapolis
Spring Wheat Sep 2013 741.25 -0.5 -0.07%
Spring Wheat Dec 2013 750 -0.25 -0.03%
Spring Wheat Mar 2014 762 +0.75 +0.10%
Spring Wheat May 2014 769.5 +0.5 +0.07%
Spring Wheat Jul 2014 775.5 -2 -0.26%
Kansas City
KCBT Red Wheat Sep 2013 706.75 unch 0.00%
KCBT Red Wheat Dec 2013 718.75 +0.75 +0.10%
KCBT Red Wheat Mar 2014 726.75 +1 +0.14%
KCBT Red Wheat May 2014 726.75 unch 0.00%
KCBT Red Wheat Jul 2014 709.75 -4 -0.56%
Light crude oil nearby futures in New York dropped 95 cents at $106.94 US per barrel.
The Canadian dollar at noon was 96.32 cents US, down from 96.73 cents the previous trading day. The U.S. dollar at noon was $1.0382 Cdn.
The Toronto Stock Exchange’s S&P/TSX composite index closed up 9.29 points, or 0.07 percent, at 12,603.25.
The Dow Jones industrial average rose 29.11 points or 0.19 percent, to 15,657.13.
The S&P 500 gained 2.73 points or 0.16 percent, to 1,709.6.
The Nasdaq Composite added 13.84 points or 0.38 percent, to 3,689.59.
For the week the TSX composite fell 0.4 percent, the Dow Jones rose 0.6 percent, the S&P 500 rose 1.1 percent and the Nasdaq climbed 2.1 percent.


