July and November canola fell slightly Friday along with most crop futures.
But on the week they were higher with gains early as traders positioned themselves for expected U.S. crop seeded acreage cuts in next week’s USDA planting report June 28. Information on traders’ outlooks for plantings is later in this report
Statistics Canada releases its planting report June 25. While seeded area might be down a little from the March report, several analysts think farmers were able to seed more than they expected in early May when snow banks in fields were still a problem.
Read Also

U.S. livestock: Hog futures hit contract highs on shock herd decline
Chicago | Reuters – Lean hog futures stormed to contract highs at the Chicago Mercantile Exchange on Friday as smaller-than-expected…
On the week July canola gain $7.10 per tonne and November rose $7.40.
Today July canola fell $1.10 and November was down 60 cents. Pressure on Friday came from weather forecasts that indicate dry, warm weather for nearly ideal growing conditions in major U.S. growing regions.
On the Canadian Prairies, although there is excess moisture in some areas and many crops are behind the usual stage of development, most crops are well established and with a bit warmer weather could surge ahead.
Crops, like most commodities, also were under pressure Friday from lingering response to the U.S. Federal Reserve’s stated intention, made clear by chair Ben Bernanke’s statement Wednesday, to scale back its bond buying stimulus program later this year.
ICE Futures Canada said the best canola July basis for Thursday narrowed to $9.70 per tonne.
The Canadian Oilseed Processors Association said members crushed 102,869 tonnes of canola in the week ending June 19, down 3.5 percent from the previous week.
That represented a capacity use of about 62 percent
Reuters reported analysts expect the USDA report next week to show U.S. spring wheat plantings were 12.132 million acres, below the March forecast of 12.701 million.
For the week, the benchmark Chicago Board of Trade July soft red winter wheat contract was up 2.3 percent, its biggest weekly percentage gain in seven weeks.
The Reuters poll of analysts put the average estimate for U.S. corn plantings at 95.313 million acres, below the USDA forecast in March for 97.282 million but still the second largest planted area in 69 years.
The average of guesses for June 1 U.S> corn stocks was 2.845 billion bushels, the smallest stockpile for that date in 16 years, and below the 3.148 billion in storage on June 1 last year, Reuters said.
The average of analysts polled on soybean plantings was 77.9 million acres, up from USDA’s March forecast for 77.1 million. The average estimate for U.S. June 1 soybean stocks was 442 million bu., down from 999 million on March 1 and 667 million a year earlier, said Reuters
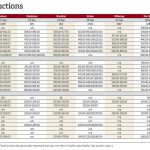
ICE Futures Canada Cdn$ per tonne
Canola Jul 2013 605.70 -1.10 -0.18%
Canola Nov 2013 555.90 -0.60 -0.11%
Canola Jan 2014 560.10 +0.10 +0.02%
Canola Mar 2014 559.10 -0.60 -0.11%
Canola May 2014 556.50 -0.60 -0.11%
Milling Wheat Jul 2013 294.00 unch 0.00%
Milling Wheat Oct 2013 294.00 unch 0.00%
Milling Wheat Dec 2013 294.00 unch 0.00%
Durum Wheat Jul 2013 301.90 unch 0.00%
Durum Wheat Oct 2013 294.90 unch 0.00%
Durum Wheat Dec 2013 299.40 unch 0.00%
Barley Jul 2013 244.00 unch 0.00%
Barley Oct 2013 194.00 unch 0.00%
Barley Dec 2013 199.00 unch 0.00%
US crops in US¢ per bushel, soymeal in US$ per short ton, soy oil in US¢ per pound.
Chicago
Soybeans Jul 2013 1493.25 -4.25 -0.28%
Soybeans Aug 2013 1413.75 -7 -0.49%
Soybeans Sep 2013 1315.75 -9.75 -0.74%
Soybeans Nov 2013 1273.5 -11.5 -0.89%
Soybeans Jan 2014 1276.5 -12 -0.93%
Soybeans Mar 2014 1273.25 -10.5 -0.82%
Soybean Meal Jul 2013 447.7 +2.1 +0.47%
Soybean Meal Aug 2013 419.6 +0.5 +0.12%
Soybean Meal Sep 2013 397.9 -0.8 -0.20%
Soybean Oil Jul 2013 48.02 -0.38 -0.79%
Soybean Oil Aug 2013 47.97 -0.37 -0.77%
Soybean Oil Sep 2013 47.56 -0.4 -0.83%
Corn Jul 2013 661.75 -11.5 -1.71%
Corn Sep 2013 592 -6.25 -1.04%
Corn Dec 2013 556.25 -4.25 -0.76%
Corn Mar 2014 567 -4 -0.70%
Corn May 2014 573.75 -4.5 -0.78%
Oats Jul 2013 395.5 +0.75 +0.19%
Oats Sep 2013 387.75 +1.75 +0.45%
Oats Dec 2013 384 -0.75 -0.19%
Oats Mar 2014 387.5 -0.25 -0.06%
Oats May 2014 389.75 -0.25 -0.06%
Wheat Jul 2013 698 -2.5 -0.36%
Wheat Sep 2013 705 -2.75 -0.39%
Wheat Dec 2013 717 -2.75 -0.38%
Wheat Mar 2014 731 -2.5 -0.34%
Wheat May 2014 740 -2.75 -0.37%
Spring Wheat Jul 2013 814 unch 0.00%
Spring Wheat Sep 2013 791.5 -2.5 -0.31%
Spring Wheat Dec 2013 800 -2 -0.25%
Spring Wheat Mar 2014 813 -2.5 -0.31%
Spring Wheat May 2014 819.5 -2 -0.24%
KCBT Red Wheat Jul 2013 736.5 -0.5 -0.07%
KCBT Red Wheat Sep 2013 736 -2 -0.27%
KCBT Red Wheat Dec 2013 750.5 -2.5 -0.33%
KCBT Red Wheat Mar 2014 763.25 -2.75 -0.36%
KCBT Red Wheat May 2014 770.5 -3 -0.39%
The Bank of Canada noon rate for the loonie was 95.51 cents US, down three quarters of a cent from 96.27 cents on Thursday. The U.S. buck was $1.047 Cdn.
Crude oil in New York fell $1.45 per barrel to $93.69 per barrel.
In early, unofficial tallies —
The Toronto Stock Exchange’s S&P/TSX composite index rose 26.90 points, or 0.22 percent, at 11,995.47.
It lost almost 200 points, or 1.6 percent, on the week.
The Dow Jones industrial average rose 44.31 points, or 0.30 percent, at 14,802.63.
The Standard & Poor’s 500 Index was up 4.45 points, or 0.28 percent, closing at 1,592.64.
The Nasdaq Composite Index was down 7.39 points, or 0.22 percent, at 3,357.25.
For the week, the Dow fell 1.8 percent, the S&P lost 2.1 percent and the Nasdaq declined 1.9 percent.


