Canola capped a positive week with an increase on Friday, supported by rising palm oil and a weak loonie.
March canola closed at $459.60 per tonne, up 90 cents or 0.2 percent on the day.
May closed at $456, up $1.30 or 0.29 percent.
For the week, March gained $6.20 or 1.6 percent and May rose $6.60 or 1.5 percent.
Currency volatility remained a key issue today with the U.S. dollar again rising against most world currencies. The loonie at noon was down 0.65 cent, falling below US80 cents again.
A stronger than expected U.S. monthly employment and wages report for January supported the U.S. buck.
Recent economic reports have given conflicting views of the strength of the U.S. economy, contributing to a debate over whether the Federal Reserve will increase interest rates in the first half of the year.
All the U.S. crops settled higher compared to a week ago thanks mostly to the big increases Tuesday when oil rose and the U.S. dollar fell.
Today soybeans were a little lower on today’s stronger U.S. dollar and pressure from a record South American soybean crop.
Read Also

U.S. livestock: Hog futures hit contract highs on shock herd decline
Chicago | Reuters – Lean hog futures stormed to contract highs at the Chicago Mercantile Exchange on Friday as smaller-than-expected…
For the week, March soybeans ended up US12.5 cents per bushel or 1.3 percent.
March soymeal was little changed over the week and March soyoil was up six percent thanks to support from palm oil futures.
Palm oil rose after the Indonesian government moved toward increased subsidies for biodiesel. Indonesia is the world’s largest producer of palm oil and if it used more of it to make biodiesel for use domestically, there will be less palm oil to export and compete against other vegetable oils.
The harvest in Brazil is advancing more rapidly than had been predicted.
Dry weather in the fall delayed the start of seeding and that led to the belief that harvest would also be late.
However about seven percent of the crop had been harvested, on par with last year at this time. Recent dry weather has helped with crop dry down.
The dry weather has analysts wondering how much corn will be seeded for the second crop, the one seeded immediately after soy harvest. The second crop provides much of Brazil’s exportable surplus.
There is however, a change to wetter weather this week.
The U.S. Department of Agriculture is scheduled to release the monthly supply/demand report on Tuesday, Feb. 10.
A Reuters poll of analysts showed the average of forecasts for the South American crops are:
- Brazil soybeans 94.67 milling tonnes, corn 74.56 million.
- Argentina soybeans 55.58 million tonnes, corn 22.54 million.
The Buenos Aires Grains Exchange estimated Argentina’s soybean crop at a record-high 57 million tonnes.
The Canadian Oilseed Processors Association said members crushed 144,916 tonnes of canola in the week ended Feb. 4, an increase of 3.2 percent.
That represented a capacity use of 79.3 percent, below the year-to-date average of 81.5 percent.
Wheat futures were mixed with Chicago up slightly but Kansas and Minneapolis down a little.
The stronger U.S. dollar weighed on wheat today, but over the week the crop rose on ideas that the price had fallen enough to attract exports and also on a short covering bounce.
Chicago March wheat gained 4.8 percent on the week, Kansas rose 3.9 percent and Minneapolis was up 3.6 percent.
The increased fighting in Ukraine and it potential to affect wheat exports was in the back of traders minds but did little to lift wheat prices.
Corn edged higher by a fraction today
The spread between March and May corn widened a little this week.
Over the week, March corn rose 15.75 cents or 4.2 percent.
U.S. job creation in January was better than expected and the government also revised upward its job numbers for November and December.
Wages also improved.
The unemployment rate rose one-tenth of a percentage point to 5.7 percent as more American re-entered the labour pool, looking for jobs as the employment picture improved.
Canada also generated more jobs than expected, but many of them were part time. Unemployment dipped by a tenth of a percentage point o 6.6 percent.
The number of full time workers declined a little.
The Toronto Stock Exchange’s S&P/TSX composite index closed down 41 points, or 0.27 percent, at 15,083.92.
The Dow Jones industrial average fell 61.97 points, or 0.35 percent, to 17,822.91, the S&P 500 lost 7.06 points, or 0.34 percent, to 2,055.46 and the Nasdaq Composite dropped 20.70 points, or 0.43 percent, to 4,744.40.
For the week, the TSX composite rose 2.8 percent, the Dow rose 3.8 percent, the S&P rose three percent and the Nasdaq rose 2.4 pct.
Light crude oil nearby futures in New York rose $1.21 to US$51.69 per barrel.
The Canadian dollar at noon was US79.85 cents, down from 80.50 cents the previous trading day. The U.S. dollar at noon was C$1.2523.
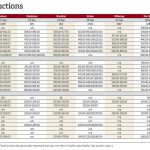
ICE Futures Canada, dollars per tonne
Canola Mar 2015 459.60 +0.90 +0.20%
Canola May 2015 456.00 +1.30 +0.29%
Canola Jul 2015 452.00 +0.40 +0.09%
Canola Nov 2015 440.90 -0.30 -0.07%
Canola Jan 2016 442.40 -0.50 -0.11%
Milling Wheat Mar 2015 227.00 -1.00 -0.44%
Milling Wheat May 2015 237.00 -1.00 -0.42%
Milling Wheat Jul 2015 240.00 -1.00 -0.41%
Durum Wheat Mar 2015 349.00 unch 0.00%
Durum Wheat May 2015 339.00 unch 0.00%
Durum Wheat Jul 2015 329.00 unch 0.00%
Barley Mar 2015 195.00 unch 0.00%
Barley May 2015 197.00 unch 0.00%
Barley Jul 2015 199.00 unch 0.00%
American crop prices in cents US/bushel, soybean meal in $US/short ton, soy oil in cents US/pound
Chicago
Soybeans Mar 2015 973.5 -7.75 -0.79%
Soybeans May 2015 980 -7.75 -0.78%
Soybeans Jul 2015 985.5 -7.25 -0.73%
Soybeans Aug 2015 985.25 -7 -0.71%
Soybeans Sep 2015 970.75 -5.5 -0.56%
Soybeans Nov 2015 960 -4.75 -0.49%
Soybean Meal Mar 2015 329.4 -2 -0.60%
Soybean Meal May 2015 323.1 -2.2 -0.68%
Soybean Meal Jul 2015 320.7 -2.5 -0.77%
Soybean Oil Mar 2015 31.82 +0.11 +0.35%
Soybean Oil May 2015 32.04 +0.12 +0.38%
Soybean Oil Jul 2015 32.22 +0.11 +0.34%
Corn Mar 2015 385.75 +0.5 +0.13%
Corn May 2015 394 +0.75 +0.19%
Corn Jul 2015 401.5 +1 +0.25%
Corn Sep 2015 408.25 +0.75 +0.18%
Corn Dec 2015 416.75 +0.75 +0.18%
Oats Mar 2015 283.5 -4.25 -1.48%
Oats May 2015 285 -0.5 -0.18%
Oats Jul 2015 285.75 -0.75 -0.26%
Oats Sep 2015 291 -0.25 -0.09%
Oats Dec 2015 288.75 -3.5 -1.20%
Wheat Mar 2015 527 +1.25 +0.24%
Wheat May 2015 529 +1.75 +0.33%
Wheat Jul 2015 531.25 +2.75 +0.52%
Wheat Sep 2015 538.75 +2.25 +0.42%
Wheat Dec 2015 550.75 +1.75 +0.32%
Minneapolis
Spring Wheat Mar 2015 577 -2 -0.35%
Spring Wheat May 2015 580.75 -2.25 -0.39%
Spring Wheat Jul 2015 586.75 -2.25 -0.38%
Spring Wheat Sep 2015 594.5 -2.25 -0.38%
Spring Wheat Dec 2015 603.5 -3 -0.49%
Kansas City
Hard Red Wheat Mar 2015 561.75 -2.25 -0.40%
Hard Red Wheat May 2015 565 -1.25 -0.22%
Hard Red Wheat Jul 2015 567.25 +0.25 +0.04%
Hard Red Wheat Sep 2015 578.5 -0.25 -0.04%
Hard Red Wheat Dec 2015 593.75 +0.25 +0.04%


