Canola futures gained ground Friday with the help of rising soybeans to post a weekly gain of $16.40 in the March contract.
The loonie continued to swoon, dropping 0.2 cent US, but the main push for canola came from continuing concern about the size of the soybeans crops in South America.
Brazil has suffered dry weather in recent weeks, trimming yield potential. In Argentina dry weather early in the growing season and now excess moisture just before harvest have also damaged crop potential.
The sunflower harvest in Argentina is off to a poor start.
Read Also
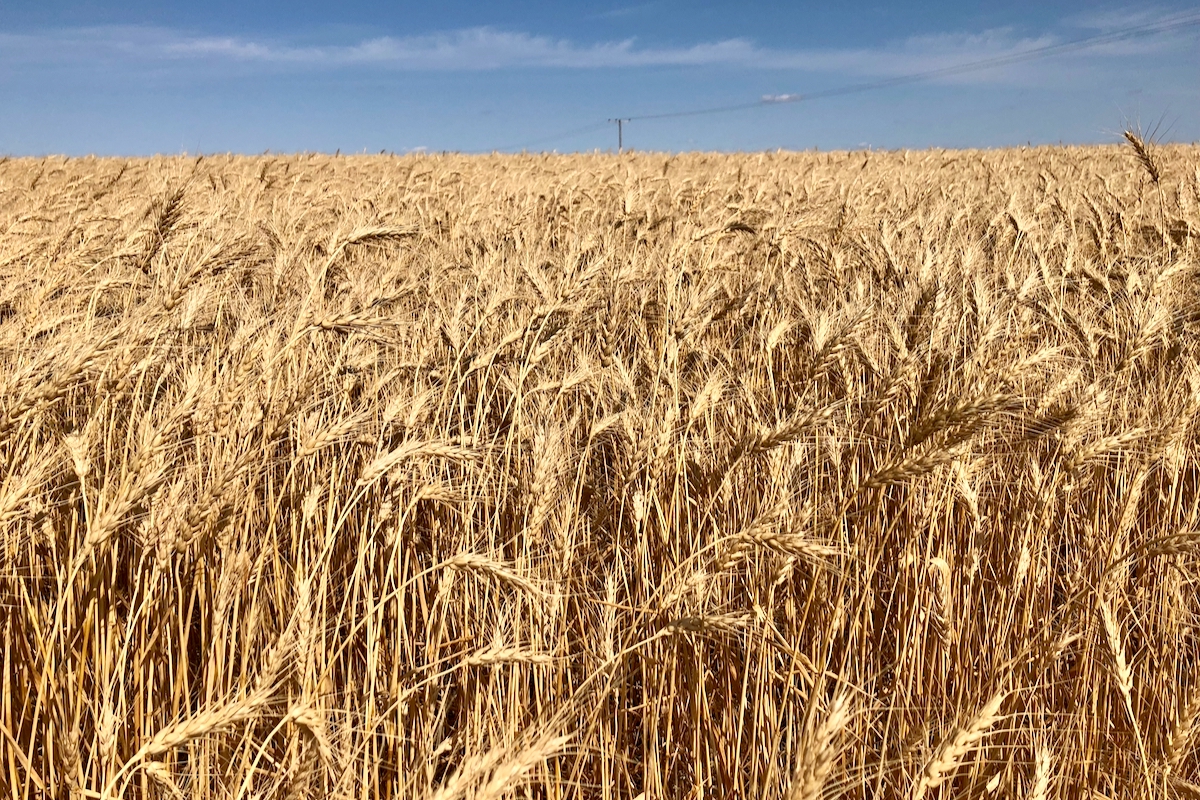
Prairie Wheat Weekly: Western Canadian bids slightly decline
The ongoing Prairie wheat harvest and a stronger Canadian dollar caused Western Canadian wheat bids to decline during the week ended Sept. 19, 2025.
Analysts are also talking about tight supplies of oilseeds in Europe and a dry period in Malaysia might trim palm oil production there.
All these factors helped push soybeans up almost one percent. March canola closed at $414.60 up $3.40.
November closed at $451.80, up $2.90
On the week, March was up $16.40 and November climbed $15.40.
Corn fell on Friday, weighed down by poor weekly U.S. exports and the prospects for another bumper U.S. corn crop this summer.
However on the week corn gained 1.6 percent, marking its fifth straight week of gains.
Chicago wheat fell a little over one percent today, but gained 1.9 percent on the week. Minneapolis spring wheat fell 2.7 percent today with talk in the market that Canadian rail movement might improve as we move into March and the likelihood of warmer weather.
Markets will watch temperatures in the U.S. next week. A cold snap is expected but the question is whether it will get cold enough to damage winter wheat and whether there will be snow to provide a blanket of insulation.
The Canadian Oilseed Processors Association said members crushed 130,238 tonnes of canola in the week ending Feb. 19, down 4.3 percent from the week before.
That represented a capacity use of a little less than 75 percent, well below the average to date of about 80 percent and last year’s pace of 88 percent.
The U.S. Department of Agriculture released more details on its production forecasts for 2014-15 crops. The outlooks, based on trends, not farmer surveys, were bearish. The market tended to brush them off, believing that the yield forecasts based on long term trends were overly optimistic.
The USDA forecast lower than expected acreage of corn and soybeans but surprisingly high yields.
There was a lot of prevented planting last year and a lot of land came out of the Conservation Reserve Program leading analysts to expect a larger overall crop seeded area, but USDA trimmed its forecast for the eight major crops by 1.7 million acres to 253.8 million.
• USDA forecast a soybean seeded area of 79.5 million acres, up from 76.5 million last year. Harvested acres are 78.5 million, up from 75.9 million last year.
Yield is seen at 45.2 bushels per acre, up from 43.3 bu.
Production was pegged at 3.55 billion bu. up from 3.289 billion bu.
• Corn area is 92 million acres, down from 95.4 million. Harvested acres are 84.6 million, down from 87.7 million.
Yield is 165.3 bu. per acre, up from 158.8 bu. last year.
Production is seen at 13.985 billion bu., up from 13.925 billion.
• Total wheat area is 55.5 million acres, down from 56.2 million. But harvested area is expected to be 47.2 million acres, up from 45.2 million last year.
Yield is 45.8 bu. per acre, down from 47.2 bu.
Production is 2.16 billion bu., up from 2.13 billion last year.
ICE Futures Canada, dollars per tonne
Canola Mar 2014 414.60 +3.40 +0.83%
Canola May 2014 424.90 +3.40 +0.81%
Canola Jul 2014 434.70 +3.40 +0.79%
Canola Nov 2014 451.80 +2.90 +0.65%
Canola Jan 2015 459.40 +2.90 +0.64%
Milling Wheat Mar 2014 193.00 -7.00 -3.50%
Milling Wheat May 2014 194.00 -4.00 -2.02%
Milling Wheat Jul 2014 195.00 -4.00 -2.01%
Durum Wheat Mar 2014 245.00 unch 0.00%
Durum Wheat May 2014 249.00 unch 0.00%
Durum Wheat Jul 2014 250.00 unch 0.00%
Barley Mar 2014 126.50 unch 0.00%
Barley May 2014 128.50 unch 0.00%
Barley Jul 2014 128.50 unch 0.00%
American crop prices in cents US/bushel, soybean meal in $US/short ton, soy oil in cents US/pound
Chicago
Soybeans Mar 2014 1370.75 +12.5 +0.92%
Soybeans May 2014 1360.25 +12.5 +0.93%
Soybeans Jul 2014 1344.75 +13 +0.98%
Soybeans Aug 2014 1299.25 +18 +1.40%
Soybeans Sep 2014 1214.75 +15 +1.25%
Soybeans Nov 2014 1153.75 +8.5 +0.74%
Soybean Meal Mar 2014 455.8 +4.9 +1.09%
Soybean Meal May 2014 440.2 +3.2 +0.73%
Soybean Meal Jul 2014 428.3 +3.7 +0.87%
Soybean Oil Mar 2014 40.95 +0.38 +0.94%
Soybean Oil May 2014 41.23 +0.41 +1.00%
Soybean Oil Jul 2014 41.44 +0.38 +0.93%
Corn Mar 2014 453 -2.75 -0.60%
Corn May 2014 459 -3.25 -0.70%
Corn Jul 2014 462.75 -4 -0.86%
Corn Sep 2014 461.5 -5 -1.07%
Corn Dec 2014 464.25 -4.5 -0.96%
Oats Mar 2014 465.5 -3 -0.64%
Oats May 2014 431.75 -2 -0.46%
Oats Jul 2014 387 -4.75 -1.21%
Oats Sep 2014 337.75 -2.25 -0.66%
Oats Dec 2014 320.25 -0.75 -0.23%
Wheat Mar 2014 609.75 -6.5 -1.05%
Wheat May 2014 605.5 -8 -1.30%
Wheat Jul 2014 609.25 -8 -1.30%
Wheat Sep 2014 617.75 -8.25 -1.32%
Wheat Dec 2014 630.5 -7.75 -1.21%
Minneapolis
Spring Wheat Mar 2014 664.25 -17.5 -2.57%
Spring Wheat May 2014 650 -10.5 -1.59%
Spring Wheat Jul 2014 652.5 -9.75 -1.47%
Spring Wheat Sep 2014 659.75 -9.75 -1.46%
Spring Wheat Dec 2014 670 -9.5 -1.40%
Kansas City
KCBT Red Wheat Mar 2014 682.75 -9 -1.30%
KCBT Red Wheat May 2014 675.5 -8.25 -1.21%
KCBT Red Wheat Jul 2014 667 -8.5 -1.26%
KCBT Red Wheat Sep 2014 673.75 -7.25 -1.06%
KCBT Red Wheat Dec 2014 684 -7.5 -1.08%
Light crude oil nearby futures in New York down 55 cents at $102.20 US per barrel.
The Bank of Canada noon rate for the loonie was 89.86 cents US, down from 90.06 cents the previous trading day. The U.S. dollar at noon was $1.1128 Cdn.
The Toronto Stock Exchange’s S&P/TSX composite index closed down 4.65 points, or 0.03 percent, at 14,205.72.
The Dow Jones industrial average fell 29.93 points or 0.19 percent, to end at 16,103.30.
The S&P 500 lost 3.53 points or 0.19 percent, to finish at 1,836.25.
The Nasdaq Composite dropped 4.135 points or 0.10 percent, closing at 4,263.41.
The TSX composite gained 1.1 percent on the week, the Dow fell 0.3 percent and the S&P 500 dipped 0.1 percent and the Nasdaq rose 0.5 percent.