Canola rose slightly on Thursday as harvest in some areas was stalled following Wednesday’s snow and rain.
The Prairie harvest advanced over the past two weeks, but some crop is still in the field and winter is fast approaching.
January canola closed at $515.70, up $3.10 or 0.60 percent.
OATS CLIMB
Chicago oats in the deferred months made a big move higher today with the May 2017 contract closing at US$2.40 ¼ , up 10 ½ cents or 4.57 percent.
Read Also
USDA considering economic aid for farmers this fall, says secretary
The U.S. Department of Agriculture is working with Congress to evaluate whether economic aid might be needed for the nation’s farmers this fall amid trade disputes and record-high yields, Agriculture Secretary Brooke Rollins said on Monday.
The U.S. dollar index pulled back from Wednesday’s 13 ½ year high.
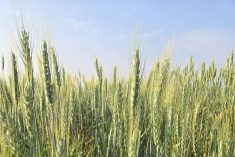
Wheat futures closed generally one percent or more higher.
The weekly USDA export sales report showed net wheat export sales were at the high end of a range of trade estimates at 598,400 tonnes.
Net soybean export sales were within the range of trade expectations at 1.42 million tonnes.
Net corn export sales topped trade forecasts at 1.66 million tonnes, a six-week high. But sales reported to Mexico fell to a one-month low as the peso slumped following the election of Donald Trump.
EURO SEEDING FORECAST
European forecaster Strategie Grains thinks farmers there will stick with soft wheat. It believes there will not be a big switch to rapeseed even though the price is more attractive.
It expects wheat area will remain at about 60 million acres, little changed from last year.
It sees rapeseed area at 16.36 million acres, up only about 222,000 acres because of poor conditions at seeding and the difficulty growing the crop since the EU banned the use of neonicotinoid insecticides.
Durum area is seen falling seven percent to 6.67 million acres.
VEG OIL TIGHT FOR NOW
Oil Wold notes that global palm oil production for 2015-16 (October to September) fell 3.6 percent because of dry weather associated with the El Nino. This has help support vegetable oil prices, which in turn have supported canola this fall.
The palm shortage continues in the first part of the current crop year, but by April yields and production should come back.
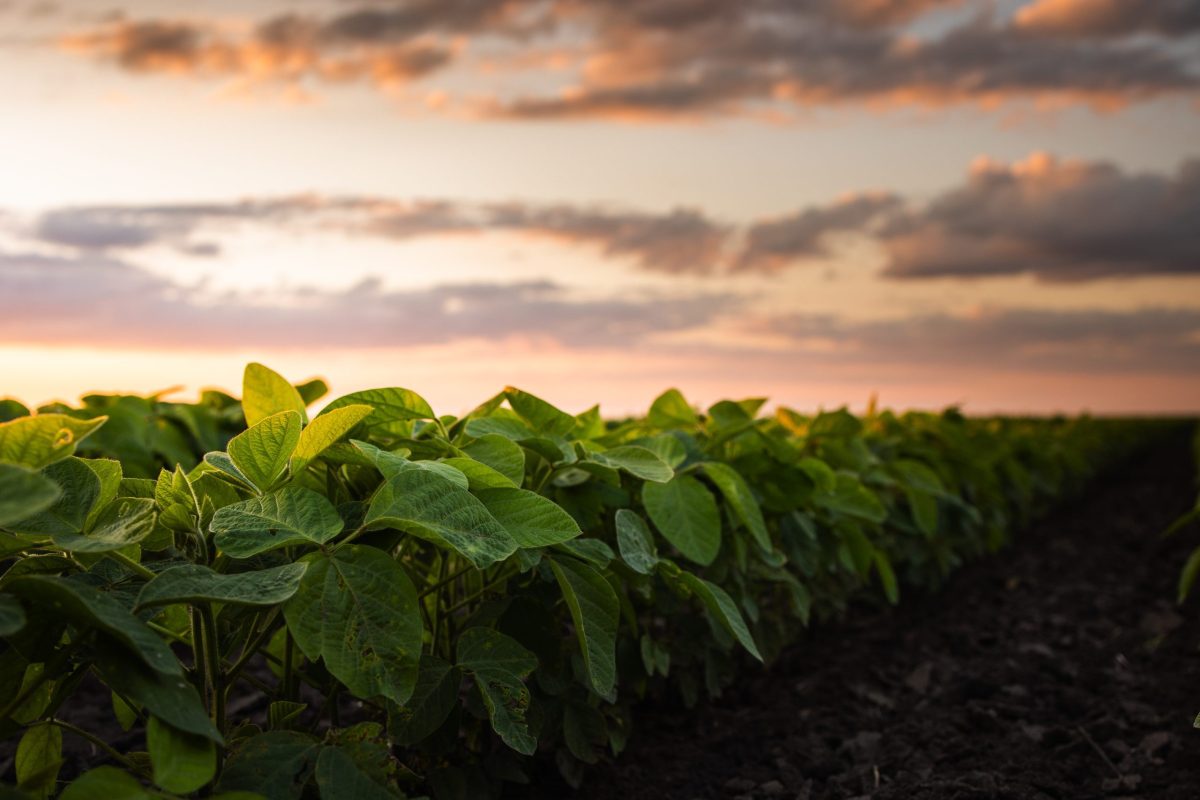
U.S. MIGHT SEED MORE SOY
Reuters reports American forecaster Informa raised its projection of US 2017 soybean seeding to a new record high of 88.612 million acres, up a whopping five million from the record set this year of 83.7 million.
It expects a decline in corn area to 90.841 million acres, from 94.5 million this spring.
SMALLEST WHEAT AREA EVER?
It sees the all wheat acreage at 47.265 million acres, down 5.8 percent from the 50.154 million seeded for harvest this year.
That would beat the previous record low of 1970 when 48.74 million acres were seeded.
The records go back to 1919.
TIME TO PRICE 2017 CANOLA PRODUCTION?
I am not a market advisor, but it might be a good time for you to talk with your profesional marketing advisor about options for pricing some of your 2017 canola crop now.
There are no guarantees in agriculture, but in this and other recent reports we have seen there are factors that could weigh down oilseed prices.
• The South American harvest will start to hit the market early in 2017.
• U.S. soybean acreage might see a big increase in 2017.
• Palm production that was hurt by drought this past year should start to recover in April.
• November 2017 canola futures today were at $506.70. Since the price decline hit in the summer of 2013 there have not been a lot of months when the price was above $500.
WIDER MARKET
Several reports on the U.S. economy today pointed to gathering strength. Applications for unemployment insurance fell to the lowest level in 43 years and inflation, as measured by the Consumer Price Index, rose 0.4 percent in October bringing the 12 month tally to 1.6 percent, the biggest 12 month increase since October 2014.
This adds weight to the potential for the Federal Reserve to raise interest rates in December.
The TSX composite rose 92.87 points of 0.63 perent to close at 14,826.09.
The Dow Jones industrial average rose 35.61 points, or 0.19 percent, to 18,903.75, the S&P 500 gained 10.16 points, or 0.47 percent, to 2,187.1 and the Nasdaq Composite added 39.39 points, or 0.74 percent, to 5,333.97.
Light crude oil nearby futures in New York were down 15 cents to US$45.42 per barrel.
The Canadian dollar at noon was US74.47 cents, down from 74.54 cents the previous trading day. The U.S. dollar at noon was C$1.3429.
Winnipeg ICE Futures Canada dollars per tonne
Canola Jan 2017 515.70 +3.10 +0.60%
Canola Mar 2017 522.30 +2.70 +0.52%
Canola May 2017 525.90 +2.50 +0.48%
Canola Jul 2017 526.30 +1.80 +0.34%
Canola Nov 2017 506.70 -1.20 -0.24%
Milling Wheat Dec 2016 229.00 -1.00 -0.43%
Milling Wheat Mar 2017 233.00 unch 0.00%
Milling Wheat May 2017 236.00 unch 0.00%
Durum Wheat Dec 2016 329.00 unch 0.00%
Durum Wheat Mar 2017 340.00 unch 0.00%
Durum Wheat May 2017 343.00 unch 0.00%
Barley Dec 2016 132.50 unch 0.00%
Barley Mar 2017 134.50 unch 0.00%
Barley May 2017 135.50 unch 0.00%
American crop prices in cents US/bushel, soybean meal in $US/short ton, soy oil in cents US/pound
Chicago
Soybeans Jan 2017 989.50 +3.75 +0.38%
Soybeans Mar 2017 998.50 +4.00 +0.40%
Soybeans May 2017 1007.25 +4.75 +0.47%
Soybeans Aug 2017 1013.25 +5.25 +0.52%
Soybeans Sep 2017 1001.75 +5.50 +0.55%
Soybean Meal Dec 2016 311.50 +3.10 +1.01%
Soybean Meal Jan 2017 313.80 +3.10 +1.00%
Soybean Meal Mar 2017 316.50 +3.50 +1.12%
Soybean Oil Dec 2016 33.70 -0.40 -1.17%
Soybean Oil Jan 2017 33.96 -0.40 -1.16%
Soybean Oil Mar 2017 34.21 -0.40 -1.16%
Corn Dec 2016 342.00 +3.50 +1.03%
Corn Mar 2017 349.75 +3.25 +0.94%
Corn May 2017 356.50 +3.00 +0.85%
Corn Jul 2017 363.50 +3.25 +0.90%
Corn Sep 2017 370.25 +2.75 +0.75%
Oats Dec 2016 235.00 +1.50 +0.64%
Oats Mar 2017 239.75 +7.25 +3.12%
Oats May 2017 240.25 +10.50 +4.57%
Oats Jul 2017 242.00 +9.75 +4.20%
Oats Sep 2017 237.25 +9.75 +4.29%
Wheat Dec 2016 403.00 +6.00 +1.51%
Wheat Mar 2017 420.00 +5.75 +1.39%
Wheat May 2017 433.25 +5.25 +1.23%
Wheat Jul 2017 448.25 +5.50 +1.24%
Wheat Sep 2017 464.00 +5.25 +1.14%
Minneapolis
Spring Wheat Dec 2016 526.75 +8.25 +1.59%
Spring Wheat Mar 2017 524.50 +5.75 +1.11%
Spring Wheat May 2017 529.00 +4.50 +0.86%
Spring Wheat Jul 2017 535.00 +4.00 +0.75%
Spring Wheat Sep 2017 541.75 +3.75 +0.70%
Kansas City
Hard Red Wheat Dec 2016 408.75 +5.25 +1.30%
Hard Red Wheat Mar 2017 425.75 +5.00 +1.19%
Hard Red Wheat May 2017 437.75 +5.00 +1.16%
Hard Red Wheat Sep 2017 462.75 +4.25 +0.93%
Chicago livestock futures in US¢/pound (rounded to two decimal places)
Live Cattle (P) Dec 2016 108.22 +0.02 +0.02%
Live Cattle (P) Feb 2017 108.80 +0.30 +0.28%
Live Cattle (P) Apr 2017 108.98 +0.36 +0.33%
Feeder Cattle (P) Nov 2016 126.98 +0.01 +0.01%
Feeder Cattle (P) Jan 2017 124.92 -0.41 -0.33%
Feeder Cattle (P) Mar 2017 121.02 -0.03 -0.02%
Lean Hogs (P) Dec 2016 47.45 -0.57 -1.19%
Lean Hogs (P) Feb 2017 54.22 -0.31 -0.57%
Lean Hogs (P) Apr 2017 61.30 -0.45 -0.73%