Canola continued to weaken Monday, continuing a trend it has followed since mid-November.
Recent days have seen a particularly sickening slump for the once strongly-supported crop, as bad overall commodity fundamentals have combined with crappy canola news to snuff out bulls’ hopes for continued strength.
“It’s in trouble,” said Errol Anderson of Pro Market.
“It’s getting it from all sides.”
The U.S. soy complex has been weak. China’s demand has weakened. The dropping canola price has busted some technical support levels.
Read Also
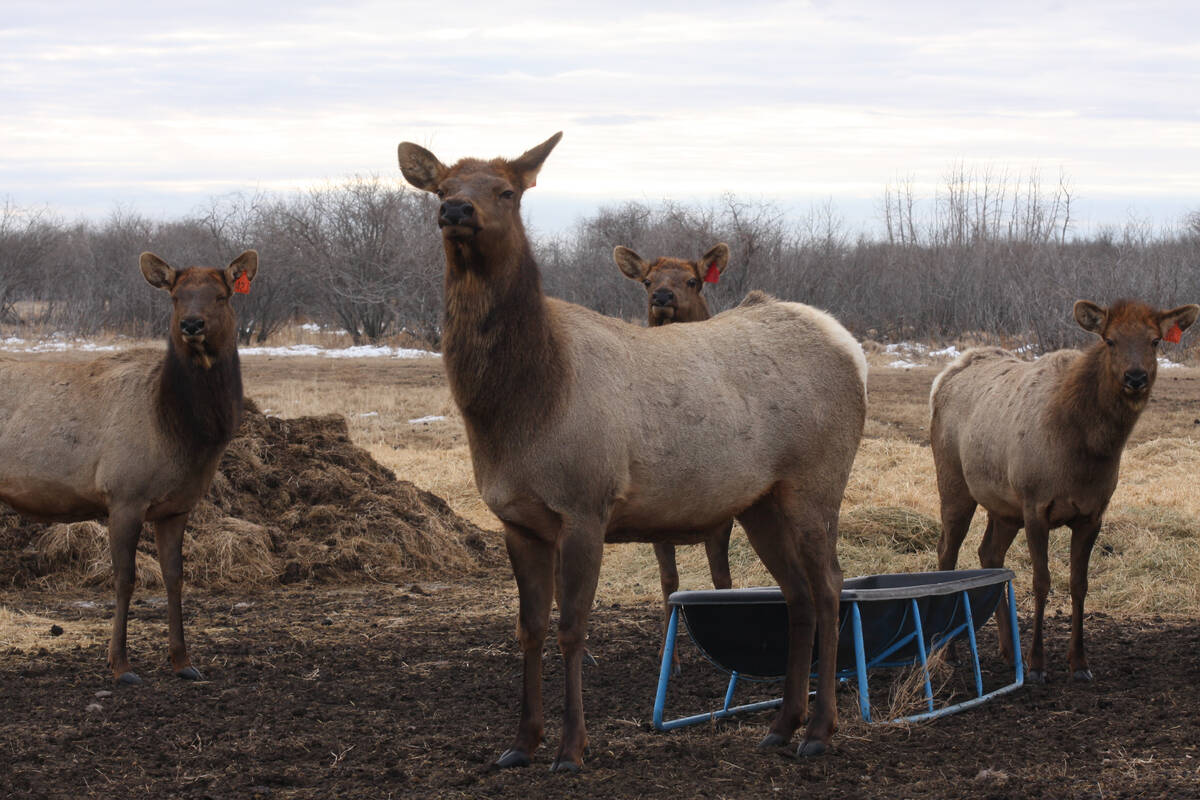
CFIA extends CWD control program consultation deadline
Date extended for consultation period of changes to CWD program
And Statistics Canada has convinced the market nobody will run out of canola any time soon.
January canola futures fell to $491.20 per tonne and March fell beneath the psychologically important level of $500, ending the day at $498.70.
Canola futures now sit at a low last seen on September 11, which was the lowest point since late June.
If that level breaks the next lows won’t be nice for those holding canola unpriced.
Anderson thinks the next support lies at about $485 for January and $492.50 for March.
There was rain in Argentina, weakening support for soybeans.
Light crude oil nearby futures in New York were down 14 cents at US$57.16 per barrel.
In the afternoon, the Canadian dollar was trading around US77.73 cents, up from 77.66 cents the previous trading day. The U.S. dollar was C$1.2865.
Winnipeg ICE Futures Canada dollars per tonne.
Canola Jan 18 491.20s -3.80 -0.77%
Canola Mar 18 498.70s -4.00 -0.80%
Canola May 18 506.90s -3.80 -0.74%
Canola Jul 18 510.70s -3.70 -0.72%
Canola Nov 18 499.10s -2.00 -0.40%
American crop prices in cents US/bushel, soybean meal in $US/short ton, soy oil in cents US/pound. Prices are displayed with fractions (2/8, 4/8, and 6/8) instead of decimals. -2 equals .25, -4 equals .50, -6 equals .75. The “s” means it is the settlement.
Chicago
Soybeans Jan 18 961-4s -5-6 -0.59%
Soybeans Mar 18 972-4s -5-4 -0.56%
Soybeans May 18 983-2s -5-6 -0.58%
Soybeans Jul 18 993-4s -5-4 -0.55%
Soybeans Aug 18 995-4s -5-4 -0.55%
Soybean Meal Jan 18 318.5s -2.1 -0.66%
Soybean Meal Mar 18 322.5s -2.0 -0.62%
Soybean Oil Jan 18 33.02s -0.14 -0.42%
Soybean Oil Mar 18 33.18s -0.16 -0.48%
Soybean Oil May 18 33.31s -0.18 -0.54%
Corn Mar 18 347-0s -0-4 -0.14%
Corn May 18 355-2s -0-4 -0.14%
Corn Jul 18 363-6s -0-4 -0.14%
Corn Sep 18 371-0s -0-2 -0.07%
Corn Dec 18 380-0s unch unch
Oats Mar 18 251-4s -2-6 -1.08%
Oats May 18 258-4s -2-2 -0.86%
Oats Jul 18 266-2s -2-2 -0.84%
Oats Sep 18 268-2s -2-2 -0.83%
Oats Dec 18 262-2s -2-2 -0.85%
Wheat Mar 18 420-4s +2-2 +0.54%
Wheat May 18 433-4s +2-6 +0.64%
Wheat Jul 18 446-6s +2-6 +0.62%
Wheat Sep 18 460-2s +2-6 +0.60%
Wheat Dec 18 477-4s +2-2 +0.47%
Minneapolis
Spring Wheat May 18 627-2s -1-0 -0.16%
Spring Wheat Jul 18 631-6s unch unch
Spring Wheat Sep 18 626-2s unch unch
Spring Wheat Dec 18 636-2s +0-2 +0.04%
Kansas City
Hard Red Wheat Mar 18 419-2s +1-6 +0.42%
Hard Red Wheat May 18 431-6s +1-4 +0.35%
Hard Red Wheat Jul 18 448-2s +2-0 +0.45%
Hard Red Wheat Sep 18 463-2s +2-2 +0.49%
Hard Red Wheat Dec 18 485-2s +2-0 +0.41%
Chicago livestock futures in US¢/pound, Pit trade
Live Cattle Dec 17 119.975s +1.075 +0.90%
Live Cattle Feb 18 120.600s -0.425 -0.35%
Live Cattle Apr 18 122.025s -0.125 -0.10%
Feeder Cattle Jan 18 147.650s -0.100 -0.07%
Feeder Cattle Mar 18 145.250s -0.300 -0.21%
Feeder Cattle Apr 18 145.550s -0.375 -0.26%
Lean Hogs Feb 18 67.400s -1.125 -1.64%
Lean Hogs Apr 18 72.250s -0.550 -0.76%
Lean Hogs May 18 77.450s -0.400 -0.51%