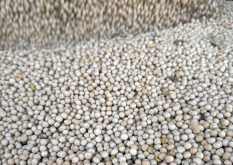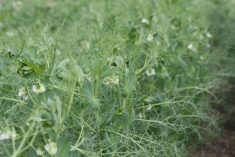
Some farmers say lentils saved their farms. Nobody argues the point. What they do argue about is how often lentils can safely go on a specific piece of land.
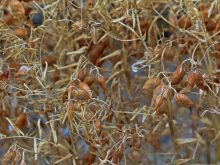
Growers are tempted to shorten their rotation because of high profit potential but the biggest enemy of lentils is aphanomyces root rot. Its spores can remain viable in the soil for a decade or longer.
Does that mean farmers should wait 10 years before putting their favorite high-producing field back into lentils?
To know when it’s safe, they need to know the risk factors and time is not the only issue affecting aphanomyces risk, according to University of Saskatchewan researcher Steve Shirtliffe.
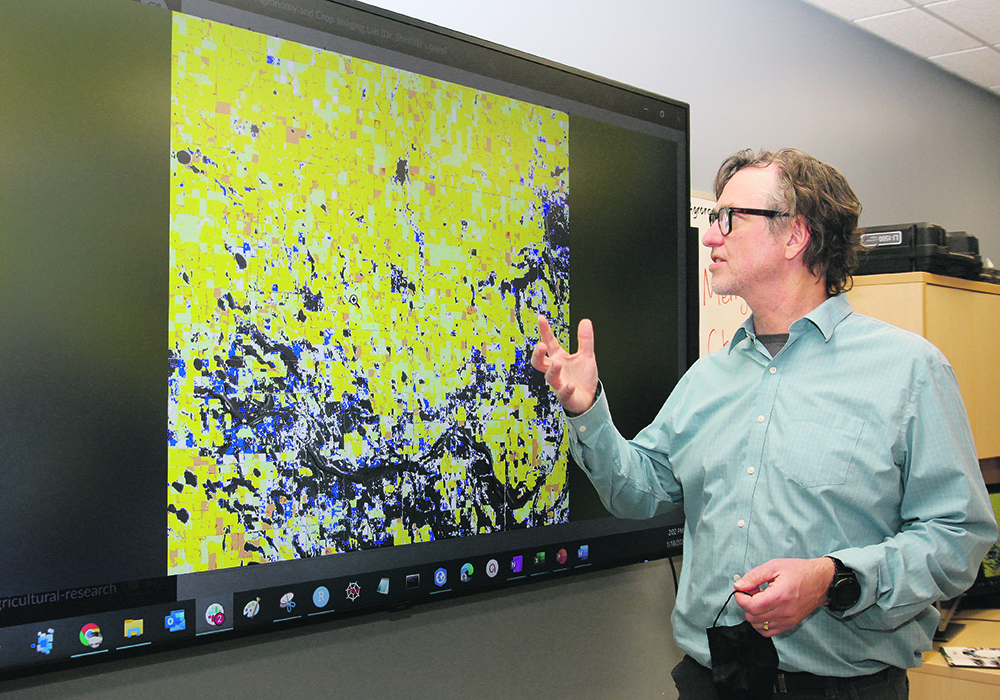
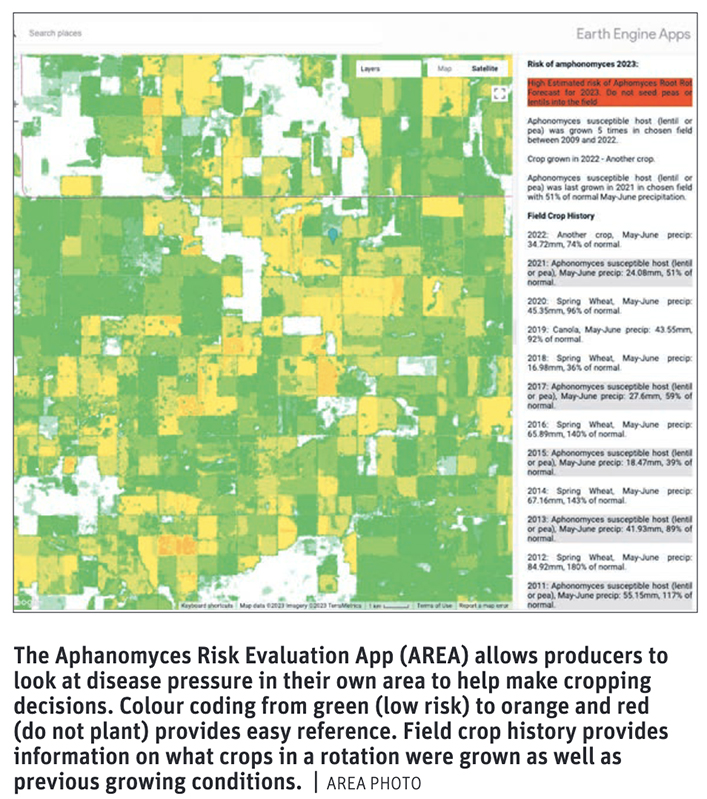
He heads a project called Aphanomyces Risk Evaluation App (AREA). It harvests and analyzes risk-related data that can predict aphanomyces in lentils. The interactive app is available free of charge.
In a phone interview, Shirtliffe explained that AREA uses remote sensing data to estimate the risk of an aphanomyces outbreak in a specific field, though it is not an actual boots-on-the-ground spore count.
“Our main data source is the Agriculture and Agri-Food Canada annual crop inventory. They use a combination of radar satellites and invisible light satellites to classify each field according to the crop grown on a field every year. I would classify them as multispectral satellites. Every year they produce a map of what’s grown on each field.
“This information is especially useful to producers buying or leasing new ground. The historical record of each target field tells the new operator if he can safely grow pulses on that soil.
“Images and analyses extend back many years, so a new operator can determine what residual crop protection products might be haunting the soil. It deals with each field on an individual basis.”
Side aperture radar creates two-dimensional images or three-dimensional reconstructions of objects it sees on the earth. It emits a polarized beam and registers the bounce back. This information tells the system what structure or surface texture is on the ground.
The reflected surface texture of a canola field would be different from that of a cereal field or a corn field. Canola is highly branched so light scatters differently than wheat, which is predominantly vertical, or lentils, which are like tiny bushes close to the ground.
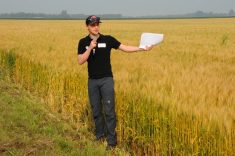
Shirtliffe says the record of what’s been grown on a field is at least 90 percent accurate. The biggest challenge for the AAFC system is determining the difference between barley and wheat.
Agriculture Canada trains these models with machine learning to recognize each crop at each location. People ground truth the images to determine what crops are grown in other fields. AREA takes this data and uses the parts needed to predict aphanomyces. It uses three parameters:
- How many years since a pea or lentil crop was grown on that particular field?
- How frequently have these crops been grown in rotation on this field?
- How wet was it the last time any of these crops were grown on that land?
Shirtliffe says those three metrics can be run through the AREA system to build a relative risk model that can be applied to any field.
If it’s only been two years since the last pea or lentil crop, there will be a high risk of root rot. If it’s been six or eight years, and it’s been wet during those growing seasons, it’s likely a medium or high risk. If it was dry during those years, the app might register a low-risk category.
Shirtliffe’s team does not go out and measure actual disease lurking in the soil. They extrapolate the risk based on data from the satellites. For the AREA app, they use field classification information. The government publishes an annual crop inventory every year.
His team uses the Google Earth Engine to crunch the data and make it available to farmers and the public on the AREA website. This is a cloud-based computing platform that allows users to run geospatial analysis on Google’s infrastructure. It finds public geospatial data like environment or soil data or precipitation and temperatures.
“Google Earth stores this information so we don’t have to. Agriculture and Agri-Food Canada has prairie field data going back 13 years, so if you want the history of a certain field you want to buy or lease, it’s all there free of charge,” says Shirtliffe.
“You can look at each pixel and then determine the aphanomyces history of that piece of ground. AREA also includes a soil texture factor based on the soil maps everyone can access. Heavier soil obviously increases the risk of root rot.
“We haven’t validated the system or the data yet. In fact, the recommendations from the plant pathologists, I’m not sure they’ve even been validated yet. We’re giving growers a tool so they themselves can measure relative risk. The feedback we’ve gotten so far has been fairly positive.
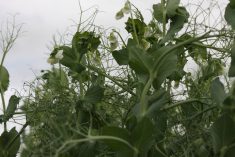
“If you had peas on that field four years ago, you might think that four years is long enough. Maybe it’s safe to put peas on that field again. But the recommendation for peas on peas is now six to eight years. Some recommendations are eight to 10 years if you know aphanomyces has infected that field.”
Shirtliffe says typical Prairies weather patterns must be factored into the equation.
“We treat weather data as a binomial classification. Wet years are those with 125 percent above average precipitation in May and June, which is the most important time period for developing root rot.
“Look at those even years, like 2002, 2004 and 2006. Well, what’s normal? In the even years, the pulse belt in Saskatchewan had some areas with 200 percent precipitation.
“Pulse growers across the Prairies can thank Saskatchewan Pulse Growers. That’s who put up the money so we could hire a programmer to put it all together. This is not the final version yet. We’ll be adding more functionality.”
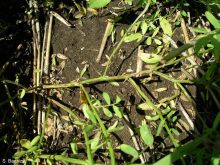
Shirtliffe uses satellite imagery to detect field moisture level. He uses a simple algorithm to see if there was less biomass growing in the wetter areas. Less biomass in a wet spot is a good indication of root rot.
“There are all kinds of new agronomic uses for satellite imagery. We have a masters student here, Jap Sandhu, and he’s looking at identifying kochia using satellites. We’re doing a ground reference with that project, so we have a fixed-wing drone that does vertical takeoff and landing. It’s like a SpaceX rocket except it doesn’t blow up.
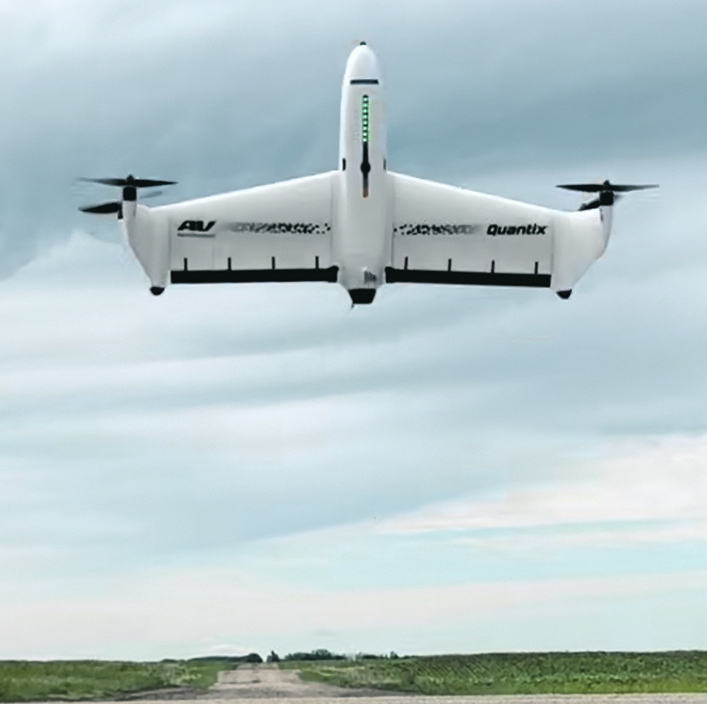
“It takes off like a helicopter, then switches into horizontal flight like an airplane. It does a quarter section in about a half hour, so it’s practical to do full field mapping.
“We have Jap going out doing aerial surveys to pinpoint kochia, and then we reference that to satellite images of the same points. Then we train up a machine learning model to define where we have kochia.”
Shirtliffe’s masters student do not have access to green-on-green sensors. For kochia detection, for example, Sandhu knows it stays green longer than the rest of a field. The algorithms use that information to identify which images are kochia.
He also uses images of saline areas that have a certain look when there is no kochia. The satellite provides that information.
“When mapping salinity, we find that soil maps aren’t accurate enough, so we’re working with Cory Willness at CropPro. They do all our salinity mapping with their SWAT box, so we get accurate soil electro-conductivity data. With that data we’ve been able to train up a salinity detection model that has much finer detail on fields we’ve never seen.
“On your regular soil maps, the polygons are pretty big and blobby. With the CropPro data, we’re able to work with 10-metre pixels.”
Access to AREA is open to anybody anywhere. Go to the app, watch the 50 minute demo video, and click on the app with a description of the field considered for lentils.
The live demonstration of AREA can be found at the SaskPulse channel at youtu.be/MwrHzIX3N5o .