January canola closed up more than two percent on Wednesday after Statistics Canada slightly trimmed its estimate of Canada’s canola crop.
Canola was also supported by rising soybeans, buoyed by concerns about excessive rain and flooding in Argentina, talk that China was buying for January delivery and technical strength as soybeans moved above the 200 day moving average for the first time since Nov. 9.
The Statistics Canada’s report today pegged the canola crop at 13.3 million tonnes, down from 13.4 million in its Oct. 4 report.
That is down almost nine percent from 2011.
Read Also
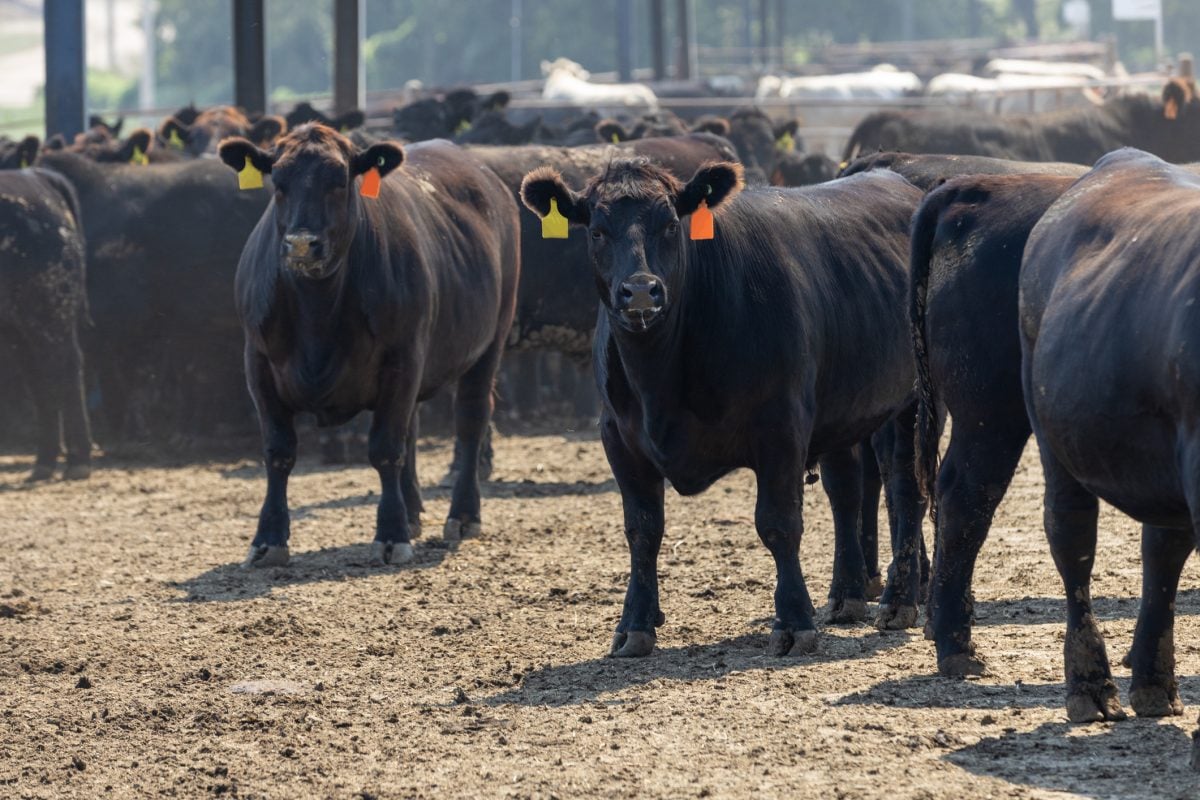
U.S. livestock: Feeder cattle hit contract highs on tight supply
Chicago | Reuters – All Chicago Mercantile Exchange feeder cattle futures and most live cattle futures hit contract highs on…
This was the result of a 19.2 percent decrease in yield to 27.7 bushels per acre. However, farmers reported a record harvested area of 21.2 million acres, up 13.1 percent from 2011.
The production figure was less than the average of analysts polled by Reuters before the report, but it was within the range of their forecasts.
January canola closed above the psychologically important $600 mark, at $602.20, up $12.40, or 2.1 percent.
All wheat production was set at 27.2 million tonnes, about two percent more than the last report and up 7.6 percent from 2011.
The news did not lower Minneapolis spring wheat futures. They rose slightly, as did corn and oats.
Wheat continues to be supported by dry conditions in the U.S. winter wheat belt and production problems in Australia and Argentina.
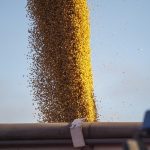
Corn was supported by stronger than expected weekly U.S. ethanol production.
The StatsCan oats number was close to analysts’ expectations, but it was down 15 percent from last year.
Statistics Canada said barley production was eight million tonnes. The average of the Reuters poll was 8.6 million tonnes and StatsCan’s Oct. 4 figure was 8.59 million.
StatsCan said the oat harvest was 2.7 million tonnes, down its previous estimate of 2.9 million tonnes.
The report is based on interviews with 29.300 farmers conducted between Oct. 26 and Nov. 14.
For the complete list of production numbers for all crops, see the end of this report
ilseed analyst Oil World noted this week that U.S. soy oil export commitments are already more than what was expected to be shipped in the full year.
Winnipeg (per tonne)
Canola Jan 13 $602.20, up $12.40 +2.10%
Canola Mar 13 $600.00, up $10.80 +1.83%
Canola May 13 $598.70, up $10.40 +1.77%
Canola Jul 13 $595.20, up $10.50 +1.80%
Milling Wheat Dec 12 $296.00, down $4.00 -1.33%
Milling Wheat Mar 13 $304.00, down $4.00 -1.30%
Milling Wheat May 13 $307.00, down $4.00 -1.29%
Durum Wheat Dec 12 $312.00, unchanged
Durum Wheat Mar 13 $316.00, unchanged
Durum Wheat May 13 $320.00, unchanged
Barley Dec 12 $245.00, unchanged
Barley Mar 13 $248.00, unchanged
Barley May 13 $249.00, unchanged
Chicago (per bushel)
Soybeans (P) Jan 13 $1479-2, up 23.75 cents +1.63%
Soybeans (P) Mar 13 $1473-6, up 23.5 +1.62%
Soybeans (P) May 13 $1450-6, up 22.75 +1.59%
Soybeans (P) Jul 13 $1439-4, up 22.75 +1.61%
Corn (P) Dec 12 $7.5325, up 6.75 +0.90%
Corn (P) Mar 13 $7.5775, up 5.75 +0.76%
Corn (P) May 13 $7.585, up 5.5 +0.73%
Oats (P) Dec 12 $3.80, up 12.75 +3.47%
Oats (P) Mar 13 $3.97, up 12.0 +3.12%
Oats (P) May 13 $4.0125, up 11.5 +2.95%
Minneapolis (per bushel)
Spring Wheat Dec 12 $9.15, up 6.75 cents +0.74%
Spring Wheat Mar 13 $9.3225, up 3.0 +0.32%
Spring Wheat May 13 $9.4175, up 3.25 +0.35%
Spring Wheat Jul 13 $9.475, up 4.75 +0.50%
The Bank of Canada noon rate for the loonie was $1.0089 US, up from $1.0074 the day before.
The U.S. currency was 99.12 cents Cdn.
Nearby light crude in New York was down 62 cents at $87.88 per barrel.
In early tallies:
The Toronto Stock Exchange S&P/TSX composite index rose 20.11 points, or 0.17 percent, to close at 12,157.29.
The Dow Jones industrial average rose 82.71 points, or 0.64 percent, to close at 13,034.49.
The S&P 500 rose 2.23 points, or 0.16 percent, to finish at 1,409.28.
The Nasdaq Composite Index dropped 22.99 points, or 0.77 percent, to finish at 2,973.70.
Statistics Canada November estimates of production of principal field crops
Spring wheat 18.845 million tonnes, up 4.6 percent from last year.
Durum 4.627 million tonnes, up 10.9 percent.
Winter wheat 3.733 million tonnes, up 20.5 percent.
Canola 13.310 million tonnes, down 8.9 percent.
Corn for grain 13.060 million tonnes up 15 percent.
Barley 8.012 million tonnes, up 1.5 percent.
Soybeans 4.930, up 14.7 percent.
Dry field peas 2.83 million tonnes, up 13.1 percent.
Oats 2.684 million tonnes, down 15 percent.
Lentils 1.473 million tonnes, down 3.3 percent.
Flax 489,000 tonnes, up 22.6 percent.
Fall rye 337,000 tonnes up 39.4 percent.
Total dry beans 274,000 tonnes, up 68.9 percent.
Special crops in tonnes
Manitoba
Sunflower seed 86,900 (2012) 19,800 (2011)
Saskatchewan
Canary seed 124,900 (2012) 128,600 (2011)
Chick peas 141,300 (2012) 75,200 (2011)
Mustard seed 82,700 (2012) 103,200 (2011)
Alberta
Chick peas 16,200 (2012) 10,400 (2011)
Mustard 35,900 (2012) 26,800 (2011)