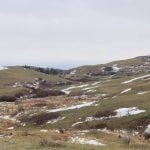

You can have a wet depression at the top of a hill and a low-elevation hill at the bottom of a slope, all in one field
Understanding the intricate chemical and physical properties of a specific spot of cropland lets you feed that spot the nutrients it requires to fully optimize productivity and maximize your profit.
As we know, agronomists use the word “optimize” rather than “maximize” when talking about yield. Extricating every last bushel from a specific zone can be costly.
Furthermore, fertilizing for maximum yield can backfire and give a negative return on investment, according to Wes Anderson, vice-president of agronomy at Croptimistic Technologies in Naicam, Sask.
Croptimistic focuses on precision agronomy tools, especially SWAT (Soil Water and Topography) maps.
Anderson says the SWAT map is a foundational soil map that Croptimistic uses as a starting base for understanding variability in a field. The map shows his clients that fertilizing a non-productive low spot usually makes the depression less productive and wastes money.
“At current fertilizer prices, you can save yourself $150 an acre simply by cutting back in the saline and peat zones. All across southern Manitoba, Saskatchewan and Alberta, it’s normal to see three or four acres in a quarter section impacted by salts.
“Everyone sees those really bad salt areas where the ground is white. Well, the fringe area, the total area impacted by salinity, is three or four times bigger than what you see. And these areas are overloaded with nutrients because they’ve always gotten the same rate as the good acres. You can shut off the ammonium sulphate in these bad spots and you get the same yield.
“Peat is the other condition that’s hard to analyze. These depressions are really high in organic matter, with lots of nitrogen and mineralization. You can cut way back on fertilizer and in many cases grow an even better crop. Crops grown on peaty soils historically lodge, they never mature, they get frozen. It’s because those acres have always gotten the full rate of nutrient.”
Anderson says in the area around Westlock, Alta., there are quarter sections with 30 to 40 acres of peat. People mistakenly assume that peat soils retain water. However, the porosity allows air to enter and dry the peat. Below the peat, there’s usually a layer of clay, which hinders drainage. That clay is the reason the peat developed in the first place.
He says the SWAT MAP is an inventory of stable soil and water properties that do not change from year to year. These include organic matter, soil texture, topsoil depth, salts, topography and elevation and pH to some extent. He says these base soil properties don’t change, although pH can change slightly over time.
“These soil properties remain constant, that’s why we use them as our base. Other variable rate (VR) providers use yield and satellite images as their base. Yield and images are affected by conditions each year. They’re not a constant. They’re not stable or predictable.
“Topography is a huge factor because it drives waterflow in most landscapes. Elevation is the other big factor. You need to understand that topography and elevation are two very different things.
“A high elevation depression is wet. It’s at the top of a large hill. And you can have a low elevation hill. This is a dry, water-shedding knoll that just happens to be located down in a larger low elevation basin. This occurs a lot. You have the top of a hill and a bottom of a depression at the same elevation. Topography is the key, not elevation.”
Anderson says Croptimistic doesn’t care about the elevation. It’s the topography that matters. He emphasizes that electrical conductivity determines if a depression drains well. A well-drained depression will measure low EC. A poorly drained depression measures high EC.
Those EC readings can be logged by a SWAT Box, a Veris cart, an EM38 or any other soil conductivity device. Anderson says the SWAT Box gives him precise data on relative soil moisture, soil texture and salt gradient. He says you don’t need to have severe salinity for the data to be useful. All landscapes have some salt gradient.
“Elevation data on its own is almost useless. Elevation data has to go into a topography model. We need to know whether it’s dry or whether its water collecting and potentially wet. Along with that, we model water flow and water accumulation. This lets us know where water’s going to flow throughout a field. We know where the watersheds are.
“It’s all about water. The most important thing about understanding field variability is understanding water. How much water is available to the crop? Is it sandy soil or heavy clay soil? A lot of times we have both in the same field. Or there’s a coarse sandy ridge. We can identify a heavy clay depression that’s at high risk of flooding out.
“You need to know where this water is coming from. Is it groundwater or re-charge water coming from an upper landscape position a half mile away? A sandy hill doesn’t behave the same as a sandy depression. A sandy depression can grow some pretty good crop if treated properly. Or a clay hill might be pretty productive because it’s got good soil texture with good water holding capacity. But a clay depression often drains slowly, so that can be an issue. These are just some of the factors we deal with.”
Anderson explains that a field may appear flat, but small topographic variations on the surface often hide major sub-soil variations. Even on the flattest of fields, water moves somewhere, which drives nutrient movement and yield potential.
He says one task the SWAT Box is especially good at is finding sidehill seeps, the term commonly used term in saline areas. In areas without salinity, these seeps are labelled as springs. The best way to solve a sidehill seep is tile drainage, but that’s not always financially feasible. Anderson says Croptimistic has several Manitoba clients who have tile drained fields. They use the SWAT Map as the starting point to figure out the best return on investment for that tile drainage.
He adds that there are about a half-dozen SWAT Boxes at use in Manitoba, owned by input dealers and farmers.
“If a field has salinity, we designate the all the worst areas as Zone 10. Every SWAT map always has 10 zones. When we soil test the zones and see the Zone 10 salts and sodium are so high that the zones cannot be productive, then we determine there’s no point in trying to farm it. Seed it down to grass and ignore it. Maybe sell the hay. In 15 years, it’ll maybe worth looking at again. The forage may help suck up water and remove some of the salts. But for now, those bad spots aren’t worth wasting money on.
“We see fields that have good soil in moist depressions. If you can drain them to get rid of the excess moisture, you can grow some good crops there every year. That’s a situation where ROI on tile drainage can be pretty good. And then we see fields where the topography is such that tile drainage just isn’t feasible. You’d need to run some pretty deep trenches.”
Anderson says the SWAT Box contains a conventional EC sensor, a cellular modem and electronics that make mapping and data collection efficient. Some companies drag around an EM38 on a sled, but he says that causes a lot of bounding around of the instrument along with reliability problems. On the other hand, the SWAT Box is up off the ground. If it’s on a truck, it quickly folds in and out of the transit position. Or it can be mounted on seeding or tillage equipment, or on a sprayer.
Commenting on the efficiency, he says some of their partners have mapped 40,000 acres in a year. An agronomist with a regular half ton and a SWAT Box can map more than 1,000 acres a day. It automatically sends data to the server. At the same time, the operator logs on and watches the operation live to see if it’s generating good data.
Once the map has been built, a qualified agronomist goes to the field to ground truth the data. Once it’s verified, soil samples can be taken. Croptimistic typically samples five of the 10 zones. They do the two extremes and three in the middle range.
“That gives us the whole breadth of soil conditions, from the driest sandy knoll to the wettest saline depression. The maps have 10 zones, but that doesn’t mean you need to write a prescription map with 10 zones. Some people overthink that point. We have 10 zones because we need that high resolution for precise recommendations.”

For farmers who want the maximum benefit, manufacturers like Väderstad and Case New Holland have drills with sectional rate control. They can put down a different rate every 10 feet. The drill can have one wing in a saline seep, and it cuts back the rate or prescribes zero fertilizer. The middle section can be in good lower slope position and the other wing might be at the top of a small knoll. And each 10-foot section gets the most appropriate rate.
“Traditional soil sampling and analysis gives us some tremendous differences in extractable nutrients. I’m sure the Western Ag PRS probes show the same thing if you took the time to do it. There’s nothing to say that we always find variability, but the vast majority of the time, there is. If we can measure it and map it, then we can manage it.
“We don’t see as much variability in potassium levels as we would in sulfur. We see significant variability in sulfur 97 percent of the time. It’s well-suited to SWAT mapping because sulfur is associated with salts, which is what we’re measuring with our EC data. And it’s associated with organic matter mineralization which is another main factor. There can be thousands of pounds in these saline areas.
“We often just shut the sulfur off in these salt spots. If you don’t have a variable rate drill, you can simply not apply to those areas. A lot of farmers work with a custom applicator to apply sulfur, so you just prescribe zero. If sulfur is 50 cents a pound and you’ve been putting on 25 pounds actual sulfur, that’s $12 an acre you can save. If you cut back 20 pounds on (nitrogen) at a buck a pound, that’s another $20. That’s $32 an acre on inputs.”