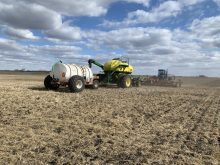
WASHINGTON, Aug 10 (Reuters) – The 2017 U.S. corn and soybean harvests will be bigger than expected despite a slow start to planting and concerns that hot and dry conditions stressed the corn crop during critical periods of development, the government said on Thursday.
The U.S. Department of Agriculture’s forecasts for corn yield and production as well as soybean yield and production topped the high end of market forecasts, with the soybean outlooks estimated at record highs.
Prices for both corn and beans fell sharply after the USDA issued its monthly crop production and supply and demand reports, with soybean futures plunging 2.1 percent to their lowest since June 20 after earlier trading at the highest since Aug. 1. Corn was down 2.5 percent.
Read Also
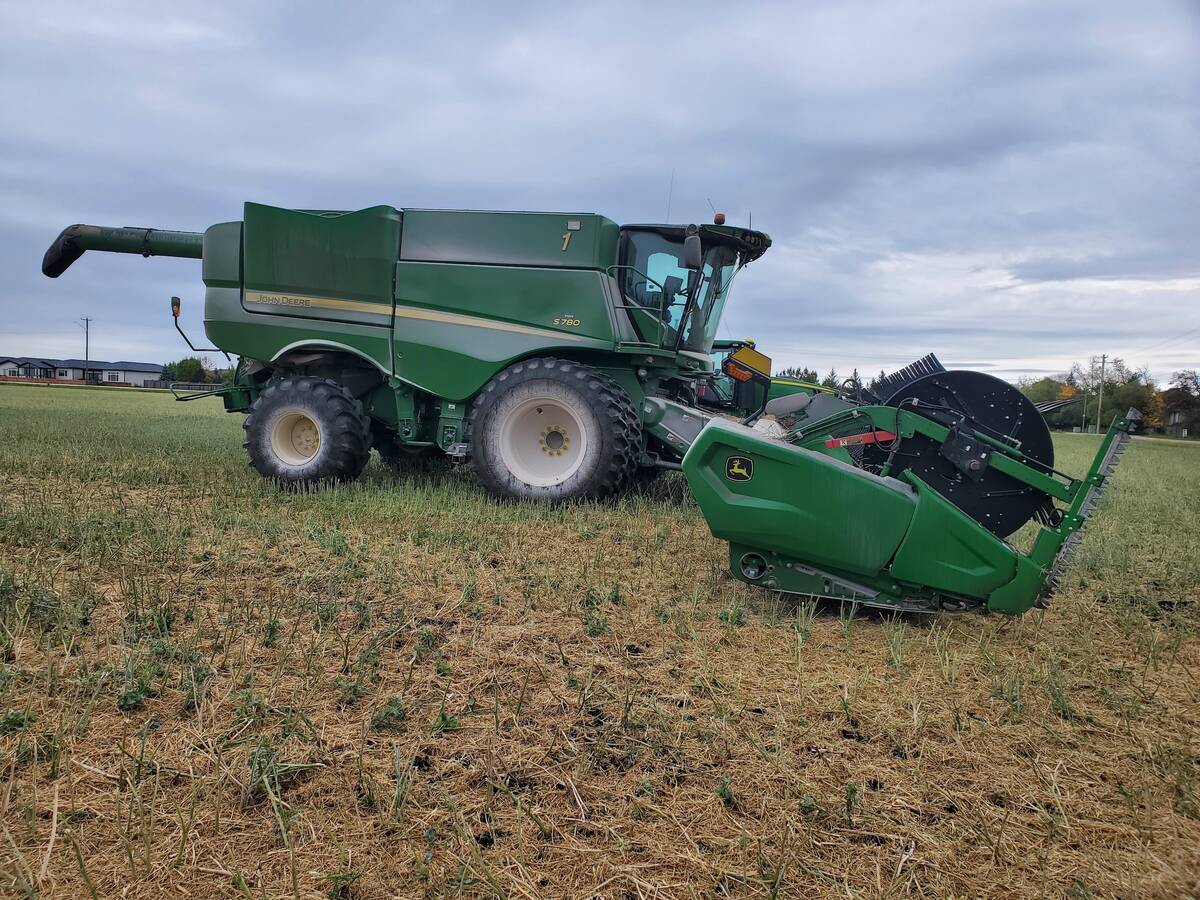
Powdery mildew can be combine fire risk
Dust from powdery mildew can cause fires in combines.
“Yields coming in above expectations are the feature for both corn and beans,” Dan Cekander of DC Analysis said, “That’s putting us under pressure. We’re going to go back to watching the weather, but this will give the market more cushion on supply.”
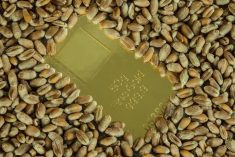
WHEAT
The USDA pegged the all-wheat harvest outlook of 1.739 billion bushels,down from its July outlook but bigger than the average of analysts estimates.
For spring wheat other than durum, the USDA was also higher than the trade expected.
It pegged production at 402 million bu., down 21 million bu. from July as a severe drought crippled development across the northern U.S. Plains.
Analysts, on average, had estimated other spring wheat production at 393 million bu.
WORLD WHEAT
The USDA also posted major increases for wheat production in the former Soviet Union, an increase of 8.6 million tonnes to a total of 133.77 million.
That more than offset cuts in Canada and the U.S.
It pegged Canada’s all wheat crop at 26.5 million tonnes, down 1.85 million.
The European Union wheat crop edged up by about 500,000 tonnes to 150.56 million.
The USDA left Australian production unchanged at 23.5 million tonnes.
World wheat production rose to 743.18 million tonnes from 737.83 million last month.
World wheat stocks at the end of 2017-18 are forecast at 264.69 million, up from 260.6 million last month. Stocks at the end of 2016-17 were 258.56 million.
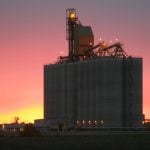
CORN
USDA pegged corn production at 14.153 billion bu., based on an average yield of 169.5 bu. per acre. Those figures, if realized, would both be the third biggest ever.
In July, USDA forecast a corn harvest of 14.255 billion bu. and a yield of 170.7 bu. per acre.
Analysts’ forecasts for corn production ranged from 13.590 billion bu. to 14.070 billion bu., with an average of 13.855 billion bu., based on a Reuters poll. Yield forecasts ranged from 162.8 bu. per acre to 168.5 bu. per acre, with an average of 166.2 bu. per acre.
SOYBEANS
For soybeans, USDA said the crop would be 4.381 billion bu., eclipsing the 2016 harvest that totaled 4.307 billion bu.. Soybean yields were seen at 49.4 bu. per acre, up from the USDA’s July projection of 48.0 bu. per acre.
Analysts’ forecasts for soybean production ranged from 4.165 billion bu. to 4.307 billion bu., with yield outlooks between 46.9 bu. per acre and 48.0 bu. per acre. The averages were 4.212 billion bu. and 47.5 bu. per acre.
The government raised its 2017-18 soybean ending stocks view to 475 million bu. to reflect the record crop projections, slightly above the high end of analysts’ forecasts. It cut its 2016-17 soybean ending stocks view to 370 million bu., largely due to a bump of 50 million bu. to the export outlook.
Corn ending stocks for 2017-18 were trimmed to 2.273 billion bu., near the high end of market forecasts.
USDA left its harvested acres projections unchanged, at 88.731 million for soybeans and 83.496 million for corn.
USDA CORN AND SOYBEAN AUGUST PRODUCTION ESTIMATES
| Billion bu. | Aug USDA | Avg Analysts | Range analysts | July USDA |
| Corn production | 14.153 | 13.855 | 13.59-14.07 | 14.255 |
| Corn yield | 169.5 | 166.2 | 162.8-168.5 | 170.7 |
| Harvested area | 83.5 | 83.418 | 83.10-83.50 | 83.496 |
| Soy production | 4.381 | 4.212 | 4.17-4.31 | 4.26 |
| Soy yield | 49.4 | 47.5 | 46.9-48.0 | 48 |
| Harvested area | 88.7 | 88.669 | 88.30-88.73 | 88.731 |
USDA WHEAT AUGUST PRODUCTION ESTIMATES
| Billion bu. | Aug USDA | Avg analysts | Range analysts | July USDA |
| All wheat | 1.739 | 1.711 | 1.550-1.784 | 1.76 |
| All winter | 1.287 | 1.278 | 1.258-1.293 | 1.279 |
| Hard red winter | 758 | 0.756 | 0.737-0.775 | 0.758 |
| Soft red winter | 306 | 0.307 | 0.300-0.311 | 0.306 |
| White winter | 260 | 0.215 | 0.205-0.224 | 0.216 |
| Other spring | 0.402 | 0.393 | 0.350-0.440 | 0.423 |
| Durum | 0.051 | 0.056 | 0.050-0.065 | 0.058 |