A forecast for Prairie rain, weaker soybeans and profit taking weighed on canola futures Thursday.
July closed at $466.60, down $2.30.
November closed at $457.60, down $2.40.
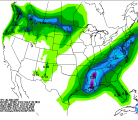
Rain could appear early next week with the largest accumulations, about an inch, in southern Alberta and southern Saskatchewan.
Click on thumbnail map below to view full map.
There is a frost advisory for tonight in much of western, central and northeastern Saskatchewan. The combination of clear skies and cold airmass will result in temperatures dipping below the freezing mark in some places.
Frost is expected to be widespread in the Kamsack and Humboldt regions.
Prior to today canola had rallied for five days but any rally will be limited by the expectation of a record large U.S. soybean crop. Weather in the U.S. Midwest generally is very good for soy and corn crop development.
Chicago and Minneapolis wheat edged higher by less than two cents today, while Kansas hard red winter wheat dipped less than two cents.
CWB today released its latest Pool Return Outlook today.
Read Also

Trade tensions boosted confidence in Canadian food system, report shows
U.S. tariff threats have boosted Canadians’ view of the nation’s food system according to the 2025 public trust report from the Canadian Centre for Food Integrity. Trust in Canadian farmers remains high but has been eclipsed by trust in scientists.
Although the rain in Oklahoma and Texas is expected to damage quality, it has not kept wheat prices higher.
One idea is that a low quality hard red winter wheat crop will be hard to sell and so low prices will be needed to move it.
Big traders continue to have a large net short position in wheat leaving the market open to bouts of short covering.
However, most forecasts point to ample global supplies of wheat.
Today the London-based International Grains Council raised its forecast for the 2015-16 global wheat crop to 715 million tonnes, from 705 million previously but below last season’s 721 million.
One weather factor that could support the wheat market is a forecast for hot weather in the region east of the Black Sea.
That is one of the main regions for wheat exports in Russia.
Soils are already somewhat dry and heat would stress crops. However, forecasts also call for rain in the region, and if it falls, then damage will likely be prevented.
The market is also aware of dry conditions in the western Prairies but that has not yet sparked serious concern among traders.
Further down the road, the trade will be watching the El Nino develop. It has the potential to reduce rainfall in Australia and lessen the monsoon season in India.
Corn futures edged higher after three days of declines. There was some short covering and an uptick in weekly ethanol production.
Light crude oil nearby futures in New York were up 17 cents to US$57.68 per barrel.
The Canadian dollar at noon was US80.15 cents, up from 80.10 cents the previous trading day. The U.S. dollar at noon was C$1.2477.
The Toronto Stock Exchange’s S&P/TSX composite index closed down 3.47 points, or 0.02 percent, at 15,107.00.
The Dow Jones industrial average fell 36.8 points, or 0.2 percent, to 18,126.19, the S&P 500 lost 2.6 points, or 0.12 percent, to 2,120.88 and the Nasdaq Composite dropped 8.62 points, or 0.17 percent, to 5,097.98.
Winnipeg ICE Futures Canada dollars per tonne
Canola Nov 2015 457.60 -2.40 -0.52%
Canola Jan 2016 457.10 -1.90 -0.41%
Canola Mar 2016 456.10 -1.90 -0.41%
Canola May 2016 455.10 -1.90 -0.42%
Milling Wheat Jul 2015 211.00 +1.00 +0.48%
Milling Wheat Oct 2015 213.00 +1.00 +0.47%
Milling Wheat Dec 2015 213.00 +1.00 +0.47%
Durum Wheat Jul 2015 298.00 unch 0.00%
Durum Wheat Oct 2015 298.00 unch 0.00%
Durum Wheat Dec 2015 303.00 unch 0.00%
Barley Jul 2015 191.00 unch 0.00%
Barley Oct 2015 177.00 unch 0.00%
Barley Dec 2015 182.00 unch 0.00%
American crop prices in cents US/bushel, soybean meal in $US/short ton, soy oil in cents US/pound
Chicago
Soybeans Jul 2015 926 -1 -0.11%
Soybeans Aug 2015 914.25 -2 -0.22%
Soybeans Sep 2015 903.25 -4.5 -0.50%
Soybeans Nov 2015 902 -4.5 -0.50%
Soybeans Jan 2016 909 -4.75 -0.52%
Soybeans Mar 2016 913.25 -4.5 -0.49%
Soybean Meal Jul 2015 304.8 -3.3 -1.07%
Soybean Meal Aug 2015 299 -3.9 -1.29%
Soybean Meal Sep 2015 295.8 -3.6 -1.20%
Soybean Oil Jul 2015 32.06 +0.33 +1.04%
Soybean Oil Sep 2015 32.15 +0.32 +1.01%
Corn Jul 2015 353.5 +4 +1.14%
Corn Sep 2015 359.5 +3.75 +1.05%
Corn Dec 2015 370 +3.25 +0.89%
Corn Mar 2016 380.5 +3 +0.79%
Corn May 2016 387.5 +2.75 +0.71%
Oats Jul 2015 240 +3.5 +1.48%
Oats Sep 2015 247.5 +5.25 +2.17%
Oats Dec 2015 253.75 +3.25 +1.30%
Oats Mar 2016 259.75 +2.5 +0.97%
Oats May 2016 266.5 +2.5 +0.95%
Wheat Jul 2015 488.75 +1 +0.21%
Wheat Sep 2015 494.5 +1.75 +0.36%
Wheat Dec 2015 509.5 +2.75 +0.54%
Wheat Mar 2016 524.5 +2.5 +0.48%
Wheat May 2016 533.75 +2.25 +0.42%
Minneapolis
Spring Wheat Jul 2015 547 +1.25 +0.23%
Spring Wheat Sep 2015 557.75 +1.5 +0.27%
Spring Wheat Dec 2015 570.75 +2.25 +0.40%
Spring Wheat Mar 2016 583.75 +2.5 +0.43%
Spring Wheat May 2016 592.75 +2.25 +0.38%
Kansas City
Hard Red Wheat Jul 2015 510.25 -1.75 -0.34%
Hard Red Wheat Sep 2015 520 -0.75 -0.14%
Hard Red Wheat Dec 2015 537.25 -0.75 -0.14%
Hard Red Wheat Mar 2016 550.5 -0.5 -0.09%
Hard Red Wheat May 2016 559.25 -0.25 -0.04%


