 Statistics Canada on Friday forecast record large canola and wheat crops but the numbers were within the range of analyst’s expectations.
Still, canola futures tumbled as analysts said traders believe that the crop size will likely rise further when the November StatsCan report is released on Dec. 4.
Read Also

Prairie CWRS bids rise, other wheats mixed
Canada Western Red Spring (CWRS) wheat bids across the Prairie provinces saw some strength during the week ended Nov. 11, taking some direction from the United States futures. However, other wheat classes were mixed.
November canola closed at $477.60, down $6.60 on the day and down $6.40 on the week.
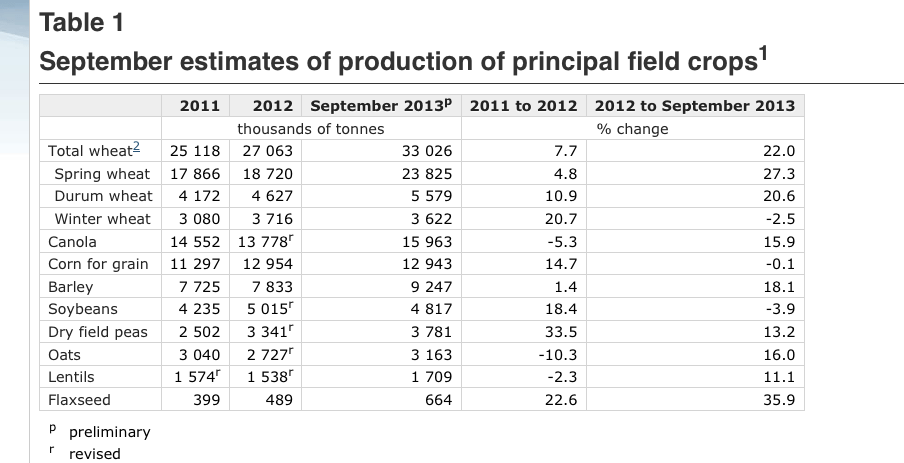
The agency put the canola crop at a record 15.96 million tonnes, up from last year’s 13.78 million. The crop shatters the goal of the Canola Council of Canada to reach 15 million tonnes by 2015.
The all wheat forecast of 33.03 million tonnes was at the high end of analysts’ expectation and it added a little downward pressure to U.S. wheat futures, that finally ran out of steam and closed a little lower after a three week rally. The rally could feed for only so long on the strong U.S. wheat exports and concerns about Black Sea region seeding delays.
Some analysts think wheat prices have risen too high relative to corn. Chicago wheat earlier this week hit a premium of $2.50 per bushel over corn, the biggest since September 2010.
The high wheat values will hurt demand as livestock feeders who use wheat to substitute cheaper corn, they say.
StatsCan pegged spring wheat at 23.825 million tonnes, up from last year’s 18.72 million. Durum was seen at 5.579 million tonnes, up from 4.627 million last year. Winter wheat was pegged at 3.622 million tonnes, down from 3.716 million last year.
U.S. soybeans rose after private analyst Informa today lowered its forecast of the U.S. soybean crop. It pegged it at 3.176 billion bushels, with a yield of 41.7 bu. per acre. That was down from its Sept. 20 estimates for a 3.224 billion bu. crop with a yield of 42.4 bu. per acre.
Soybean and corn futures were also supported by rain that has delayed harvest in parts of the U.S. growing region yesterday and today. Snow fell in South Dakota.
More moisture is expected late next week.
Corn shook off the news that Informa raised its corn yield estimate to 158.8 bu. per acre from 157.6, and raised its corn production forecast to 14.010 billion bu. from 13.889 billion.
The U.S. Department of Agriculture’s current forecast is 13.843 billion bu. with a yield of 155.3 bu. per acre and a soybean crop of 3.149 billion bu. with a yield of 41.2 bu. per acre.
The next USDA supply and demand report that was to come out Oct. 11 likely will not be available because of the partial government shutdown in the U.S.
The Canadian Oilseed Processors Association said its members crushed 147,007 tonnes of canola in the week ending Oct. 2, down 2.3 percent from the week before.
That represented a capacity use of almost 86 percent.
The StatsCan production number for barley was 9.247 million tonnes, up from its August forecast of 8.55 million but it was within the range of pre report expectations. Barley prices have been falling on expectation of a big Canadian harvest and on falling corn prices.
All the pulse and special crop production estimates were also much higher than StatsCan’s previous report.
Only oats came in smaller than the previous report with StatsCan pegging it at 3.163 million tonnes, down from 3.24 million tonnes in the last report. That was due to a reduced seeded acreage of 1.219 million hectares, down from the previous forecast of 1.364 million.
ICE Futures Canada, dollars per tonne
Canola Nov 2013 477.60 -6.60 -1.36%
Canola Jan 2014 486.90 -6.40 -1.30%
Canola Mar 2014 494.10 -6.40 -1.28%
Canola May 2014 499.80 -6.70 -1.32%
Canola Jul 2014 504.50 -6.90 -1.35%
Milling Wheat Oct 2013 241.00 -1.00 -0.41%
Milling Wheat Dec 2013 243.00 -1.00 -0.41%
Milling Wheat Mar 2014 249.00 +1.00 +0.40%
Durum Wheat Oct 2013 243.00 unch 0.00%
Durum Wheat Dec 2013 247.00 unch 0.00%
Durum Wheat Mar 2014 253.00 unch 0.00%
Barley Oct 2013 149.00 unch 0.00%
Barley Dec 2013 152.00 unch 0.00%
Barley Mar 2014 154.00 unch 0.00%
American crop prices in cents US/bushel, soybean meal in $US/short ton, soy oil in cents US/pound
Chicago
Soybeans Nov 2013 1295.00 +6.75 +0.52%
Soybeans Jan 2014 1295.00 +6 +0.47%
Soybeans Mar 2014 1279.25 +8.5 +0.67%
Soybeans May 2014 1257.75 +7.25 +0.58%
Soybeans Jul 2014 1253.25 +8.25 +0.66%
Soybeans Aug 2014 1242.5 0+8.25 +0.67%
Soybean Meal Oct 2013 431.3 +3.5 +0.82%
Soybean Meal Dec 2013 418.4 +3.1 +0.75%
Soybean Meal Jan 2014 413.7 +3.9 +0.95%
Soybean Oil Oct 2013 39.99 -0.02 -0.05%
Soybean Oil Dec 2013 40.24 -0.03 -0.07%
Soybean Oil Jan 2014 40.56 -0.03 -0.07%
Corn Dec 2013 443.25 +4 +0.91%
Corn Mar 2014 456.00 +4 +0.88%
Corn May 2014 464.50 +4.25 +0.92%
Corn Jul 2014 471.75 +4.25 +0.91%
Corn Sep 2014 477.50 +4.25 +0.90%
Oats Dec 2013 318.25 +1.25 +0.39%
Oats Mar 2014 306.25 -2.25 -0.73%
Oats May 2014 305.75 -2 -0.65%
Oats Jul 2014 300.50 -2 -0.66%
Oats Sep 2014 305.50 -2 -0.65%
Wheat Dec 2013 687.00 -2.25 -0.33%
Wheat Mar 2014 696.25 -0.75 -0.11%
Wheat May 2014 701.75 +0.5 +0.07%
Wheat Jul 2014 693.75 +2.25 +0.33%
Wheat Sep 2014 699.25 +1.75 +0.25%
Minneapolis
Spring Wheat Dec 2013 746.25 -4 -0.53%
Spring Wheat Mar 2014 752.75 -2 -0.26%
Spring Wheat May 2014 757.00 +1.5 +0.20%
Spring Wheat Jul 2014 759.75 +4.5 +0.60%
Spring Wheat Sep 2014 761.25 +7.5 +1.00%
Kansas City
KCBT Red Wheat Dec 2013 750.25 -5.25 -0.69%
KCBT Red Wheat Mar 2014 749.50 -4 -0.53%
KCBT Red Wheat May 2014 748.75 -1 -0.13%
KCBT Red Wheat Jul 2014 733.00 +1.75 +0.24%
KCBT Red Wheat Sep 2014 740.75 +2.5 +0.34%
Light crude oil nearby futures in New York dropped 79 cents at $103.31 US per barrel.
The Bank of Canada noon rate for the loonie was 97.03 cents US, up from 96.87 cents the previous trading day. The U.S. dollar at noon was $1.0306 Cdn.
U.S. stock markets took the fourth day of the partial government shutdown in stride. However, analysts are more worried about how the warring parties will handle the debt ceiling issue. The debt ceiling must be raised by Oct. 17 or the U.S. will start to default on some of its debts. There have been U.S. government shutdowns before, but there has never been a default.
In unofficial early tallies
The Toronto Stock Exchange composite closed at 12,758.65, up 23.52 points or 0.18 percent.
The Dow Jones industrial average rose 76.35 points, or 0.51 percent, at 15,072.83.
The Standard & Poor’s 500 Index was up 11.83 points, or 0.70 percent, at 1,690.49.
The Nasdaq Composite Index climbed 33.41 points, or 0.89 percent, at 3,807.75.
For the week, the TSX fell 0.67 percent. The Dow and S&P 500 ended with losses for the week while the Nasdaq ended with a gain.