Agriculture Canada’s Canadian Crop Metrics tool contains information on drought classifications, frost risk, precipitation and weather forecasts
Farmers, analysts and the entire grain sector have a new one-stop shop for everything related to crop yields.
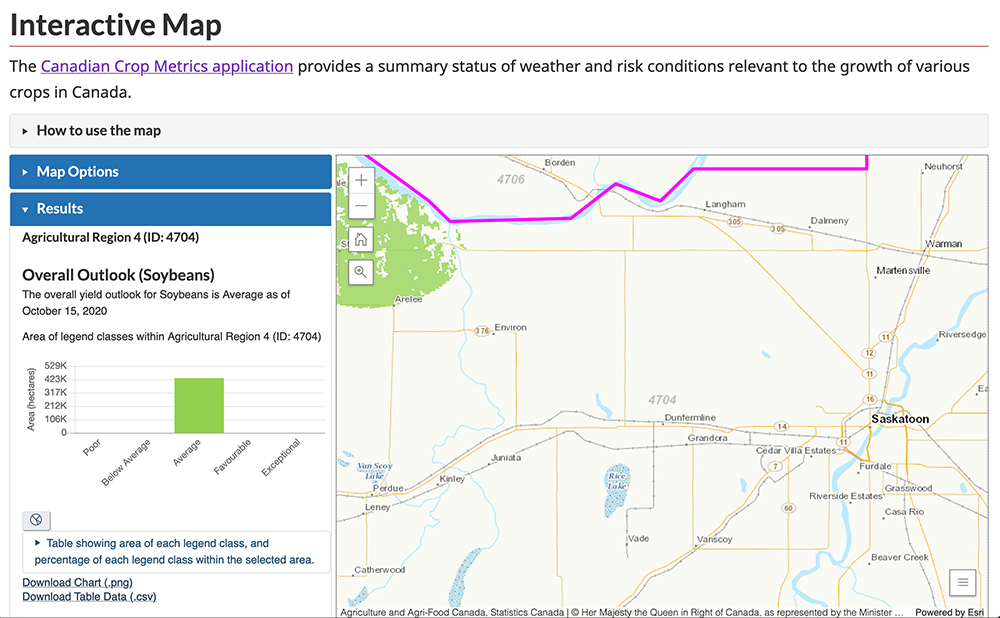
Agriculture Canada recently released its new Canadian Crop Metrics tool available at www.agr.gc.ca/atlas/cropmetrics.
“It allows the user to look at a specific region and generate reports, graphs and tables to compare current conditions to historical for 11 different crop types,” said Catherine Champagne, manager of national agroclimate information services with Agriculture Canada.
The crops include grains, oilseeds and pulses. There is no data for special crops like mustard and canaryseed.
Read Also

Farming Smarter receives financial boost from Alberta government for potato research
Farming Smarter near Lethbridge got a boost to its research equipment, thanks to the Alberta government’s increase in funding for research associations.
Yield estimates will be updated monthly during the growing season at the beginning of July, August, September and October. The October update is only for corn and soybeans.
Users can pick from different geographies, ranging from Canada-wide down to an agriculture census region level of detail. But it won’t be able to show a grower what is happening on their particular farm.
“The tool is really intended to look at regional differences in crop yields and not farm-level differences,” she said.
Yields can be compared to last year or five-year averages.
Champagne said the model that is used is more complicated than Statistics Canada’s Crop Condition Assessment Program’s (CCAP) satellite-based vegetative growth yield maps.
It incorporates the CCAP data but also weather data, soil moisture data and even pest data.
Agriculture Canada made the tool public in response to complaints from market analysts who are tired of “looking all over the place” for real-time yield data.
“One of the advantages of this tool is that all of the information that is really pertinent to crop yields is all in one place,” she said.
It contains information on drought classifications, frost risk and precipitation.
The tool also includes weather forecasts for number of drying days, cool wave days, heat wave days, ice freeze days and total precipitation. The forecasts are for one week to four weeks in duration.
Agriculture Canada hopes to incorporate some pest risk factors between now and the next yield forecast in July, 2021.
Champagne said the government would appreciate user feedback on this new product.
“We’re always looking to innovate and make things more useful,” she said.
Todd Lewis, president of the Agricultural Producers Association of Saskatchewan, hopes the tool will provide better transparency on real-time yields. That would have proved useful in a year like this.
“The trade was talking about an above-average crop and really everybody on the ground had a pretty fair idea that it was going to be average at best,” he said.
Lewis might be disappointed because Champagne said it is the same model that Statistics Canada uses for its September yield estimates.
But it does provide a regional breakdown of yields.
Lewis doesn’t think that feature will be particularly useful to farmers because they already get that from crop insurance data.
“If you’re in crop insurance you have a pretty good idea how you’re stacking up against everybody else,” he said.
And there are plenty of other sources of weather information farmers can draw upon in addition to just plain old observation techniques.
“If you’re sitting in Gray, Sask., you don’t need Statistics Canada to tell you that it’s dry,” said Lewis.