Frank McKinny “Kin” Hubbard, an Indiana journalist, humourist and cartoonist, once said, “Don’t knock the weather; nine-tenths of the people couldn’t start a conversation if it didn’t change once in a while.”
He makes a good point. Change is often good. It so happens that our weather page is changing right along with the temperature, starting with this issue.
For the past several years, the temperature and precipitation figures for stations across Western Canada have been provided by Environment Canada.
But last year, the agency made some changes, and it sure provoked conversations in the newsroom when we discovered we would no longer be able to access assured high-quality weather data.
Read Also

Farmer ownership cannot be seen as a guarantee for success
It’s a powerful movement when people band together to form co-ops and credit unions, but member ownership is no guarantee of success.
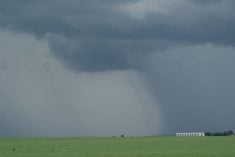
So, whither the weather?
The weather page has long been a reader favourite, if only so they have something to talk about later.
I look after the weather page each week and was not anxious to field 66,000 calls in the coming week if people were forced to search for other polite conversation starters.
Enter to the rescue the Prairie Farm Rehabilitation Administration, whose interest in weather rivals that of Environment Canada. Now expanding in scope to become the National Agroclimate Information Service, the helpful staff at NAIS can provide us with weather data, assuring civilized small talk for the foreseeable future, and they can tailor it to include more sites.
Take a look at the weather page on page 87 and see our new format. The weekly forecast maps are still there, but easier to use now that the good folks at WeatherTec Services have added the weekly high and low values for precipitation and temperature into the maps. Now, when you see that Calgary is expecting above average precipitation for the week, you can also see what “average” really means for that area.
We’ve added new stations: Coronach, Val Marie, Maple Creek, Claresholm, Milk River, Wainwright, Morden, Cranbrook, Kelowna and Victoria. We dropped stations that aren’t in growing areas or have had unreliable data in the past: Broadview, Nipawin, North Battleford, Edson, Grande Prairie, High Level, Carman, Prince George, Hay River and Vancouver.
Next spring NAIS plans to use the latest satellite technology to provide detailed maps that will help explain rainfall patterns, crop development stages, insect infestations and more. We hope to integrate these products to provide even more relevant and accurate weather information than before.
Of course, in our first test run with NAIS last week, there were malfunctions in the automatic reporting machines at three sites, so it wasn’t as perfect as we’d hoped.
But it gives us something to talk about.