Grain and oilseed futures fell again last week partly on the perception that supplies are more than ample.
But is there really a burdensome surplus?
Yes and no, depending on how you look at it.
At the end of the 2004-05 crop year International Grains Council statistics show world wheat stocks at 22 percent of consumption, which is well below the 10 year average. However, the stocks held by the five major exporters – Canada, Argentina, Australia, the United States and the European Union – stood at 8.5 percent of global consumption, at the high end of the 10 year average.
Read Also
Crop estimates show mixed results
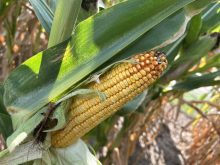
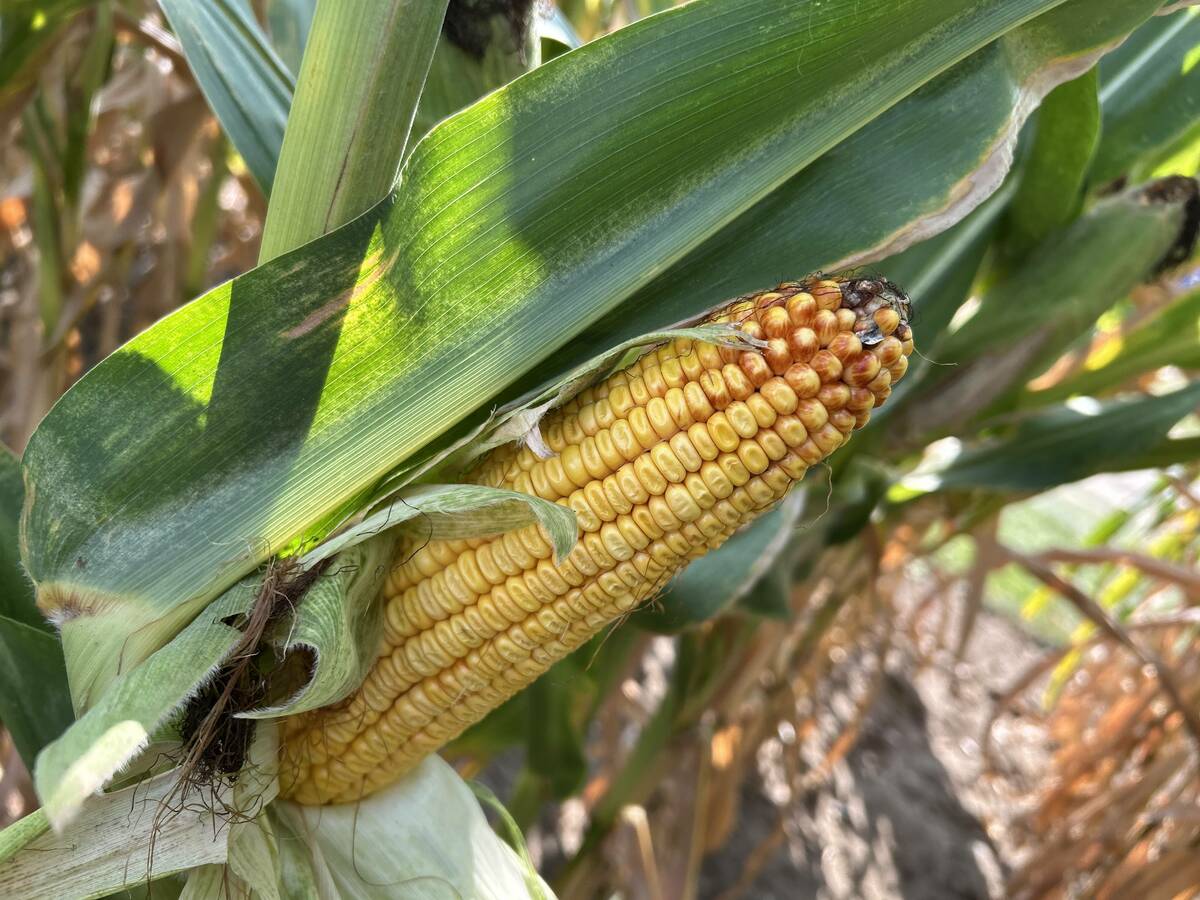
Model-based estimates used by Statistics Canada showed the 2025/26 crop year has seen increases in canola, corn for grain, oats and lentils production while seeing dips in spring wheat, durum wheat, soybeans and barley in comparison to 2024/25.
The IGC forecasts that with smaller production and increased consumption, the global stocks-to-use ratio will fall to 21 percent at the end of 2005-06 and the exporters ratio will drop to 7.6 percent.
So globally speaking, wheat stocks are tight, but the main exporters have a relatively good supply.
The global stocks-to-use ratio has been fairly steady in recent years. In 2003-04 it was 21.4 percent, 22 percent in 2004-05 and is forecast at 21 percent in 2005-06. The five exporters’ share of stocks was a tight 6.7 percent in 2003-04, rose to 8.5 percent 2004-05 and is forecast to drop to 7.6 percent in 2005-06.
The U.S. Department of Agriculture estimate of farmer’s wheat returns was steady at $3.40 US per bushel in 2003-04 and 2004-05. The mid point of the range forecast for this year is also $3.40. The Canadian Wheat Board’s returns are also fairly steady over the period, with a 2003-04 final payment of $205 Cdn per tonne at port, $208 in 2004-05 and a Pool Return Outlook of $201 for 2005-06.
The stability in Canadian prices is surprising because the Canadian dollar has strengthened from about 71 cents US two years ago to about 85 cents today, a factor that should weigh down prices here.
The strongest wheat prices recently were in 2002-03 when global stocks were at 27.5 percent of consumption and the five exporters were at 7.2 percent, but those numbers were down substantially from the year before because of production shortfalls in Canada, the U.S. and Australia.
As for oilseeds, soybeans have the biggest impact on prices. Again, the market responds not simply to global supply, but also to what is happening with the major exporter, in this case the U.S.
For example, the best prices in recent years happened in 2003-04 when world stocks-to-use were at a burdensome 39 percent but the U.S. ratio was at a tight 6.7 percent.
This year, the world stocks-to-use ratio is down to a much more manageable 21.6 percent but the U.S. is holding a far larger portion of the stocks at 18.6 percent, the highest this decade, resulting in a perception of oversupply and weak oilseed prices.