CALGARY — As a farm chemical sales representative Gus Gustafson listened to many farmer and dealer complaints about products that didn’t work.
Among the many reasons for low effectiveness is application of the chemical at the wrong growth stage.
When he retired, Gustafson remembered those complaints. He started combing research papers that tracked plants’ growth stages as well as farmer and chemical company reports that monitored what was happening in the fields. Most of that research has never gone beyond scientific circles, but he could see a use for it.
Read Also
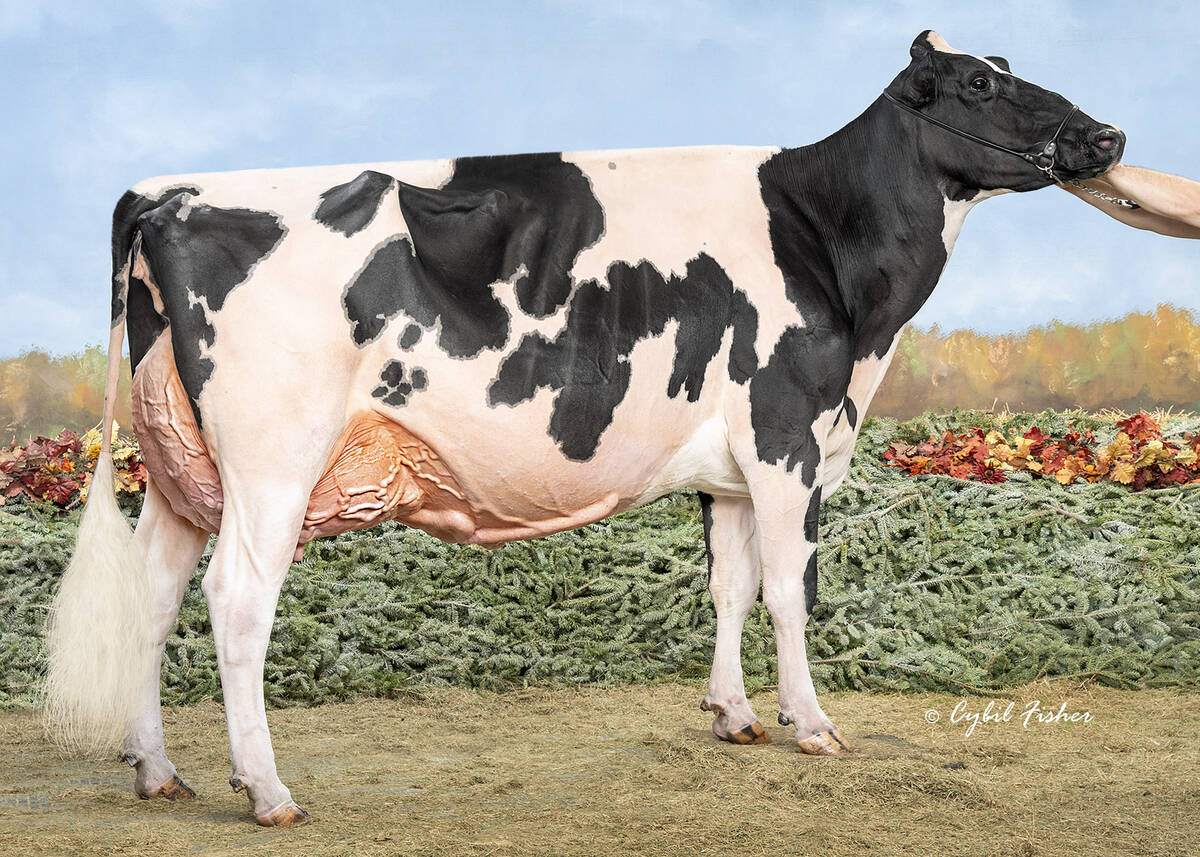
Saskatchewan dairy farm breeds international champion
A Saskatchewan bred cow made history at the 2025 World Dairy Expo in Madison, Wisconsin, when she was named grand champion in the five-year-old Holstein class.
“I took hundreds of those reports and analyzed them.”
Charting the variables
He began calculating not only the stages of growth in a plant’s life cycle, but how such variables as heat affect plant development. He’s come up with charts showing growth stages predicted on the basis of the year’s weather information.
He looked at location and weather data from Environment Canada for specific areas on a daily basis. He examined the maximum and minimum temperatures to calculate heat units because it takes so many heat units to achieve each stage of growth. Working with a partner, a computer program has been written to produce the charts showing this data. The chart is like a graph based on weeks, and curves upward over the summer.
“When the curve is flat that means there’s very few heat units and the crop is not growing very fast.
“You don’t go by time because no two years are the same and no weather stations are the same.”
To use this information in the field, a pesticide applicator needs to know the biological age of a plant to make the spraying most effective. People seed on different dates for various reasons and when the crop reaches a certain size they decide it’s time to spray.
He suggests recording seeding dates, which can then correlate with heat units and the age of the plants to make the chemical most effective. It can also help determine which pesticide to select because different mixtures are effective at different growth stages.
For now, he has data on barley, wheat, Argentine canola and is looking at developing charts for weeds and other crops like corn. So far, he has focused on Alberta, selling the service to 16 different groups. He hopes to expand into other provinces because each area is unique.
He’s selling this service called Growth Stage to chemical companies and has done some work for the Alberta Hail and Crop Insurance Corp.
Guidebooks on chemical application list when chemicals should be applied, such as during the four-leaf stage of development in the plant’s life. Figuring out that stage is more difficult than many realize, said Gustafson.
A plant may only have one leaf but its biological age is much higher than suspected, he said. Lower leaves could be missing because of disease, wind or frost damage. Also, as the plant starts to tiller it gets harder to determine its biological age.
Calculating heat units
A cereal’s development is spurred largely by heat energy or “heat units,” not time. For example, some cereals require 100 heat units to emerge while canola needs more warmth. Instead of counting the number of days it takes a plant to emerge, Gustafson worked it out by the number of heat units.
“All of your cereal crops that you plant … you’re planting seeds so they all have to have a certain temperature. They all have to have certain things happen to them before they germinate.”
Research from Lacombe showed one variety of barley required 75.2 heat units to go from the two-leaf to the four-leaf stage. To go to the boot or heading stage takes different levels of heat.


