Excess moisture in the United States and dry conditions in Canada lifted crop futures prices on Wednesday.
July canola closed up $6 at $497 per tonne. July climbed as high as $500 at one point but could not break through that barrier.
Most-active November canola rose $6.80 to $496.20.
A fairly widespread area of the Prairies should get rain Thursday-Friday and again on the weekend although generally, accumulations are not expected to be large.
U.S. soybean futures rose as concerns about rain preventing some farmers planting their full acreage sparked a round of short-covering, traders said.
Read Also
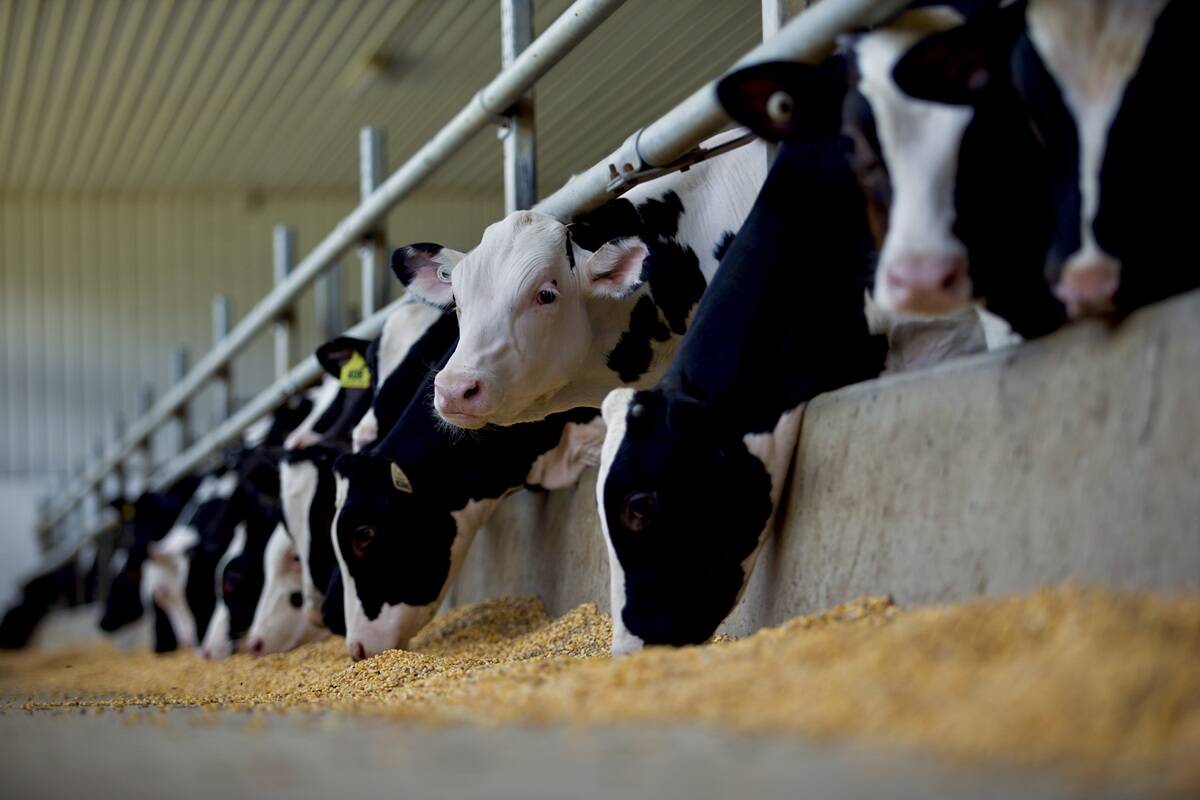
Confusion cleared on Canadian calf import changes
A Canadian Food Inspection Agency (CFIA) announcement on import regulations for feeder calves caused some confusion on the administrative side of Canada’s cattle industry earlier this month
Corn and wheat futures also closed higher, supported by technical buying as well as some weather-related concerns.
Soybeans, which notched a second straight day of double digit gains, surged to their highest since May 14.
“We are finally starting to run into some bad news for the crop, in the form of field washouts and prevented planting, with rains this week from Tropical Storm Bill unlikely to let farmers into the fields in Arkansas and Missouri,” Charlie Sernatinger, global head of grain futures at ED&F Man Capital said in a note.
“Whether one wants to talk about old crop or new crop, soybeans seem to have the cash market strength, profitable end users, solid demand, wet forecasts, unplanted acres, tightening back end spreads and critical yield-determining plant dates already passing by,” Tregg Cronin, market analyst with Halo Commodities, said.
Traders said that the excessive rains also might be hurting the health of the corn, fostering conditions for disease and washing some fertilizer from the soil.
The rains in the Midwest would likely delay the harvest of the soft red winter wheat crop.
All three commodities received additional support from a slowdown in the movement of grains due to wet weather.
CME Group Inc declared force majeure for all corn and soybean shipping stations because of flooding on the Illinois River. A majority of facilities on the river, which are delivery points for crops traded on CME’s Chicago Board of Trade, are unable to load crops due to high water levels.
Light crude oil nearby futures in New York were down 5 cents to US$59.92 per barrel.
The Canadian dollar at noon was US81.25 cents, up from 81.10 cents the previous trading day. The U.S. dollar at noon was C$1.2308.
The U.S. Federal Reserve today issued a statement that supported the outlook for an interest rate high later this year and possibly another before the end of the year.
But as always, the bank said it would closely follow the employment and wage situation. Chair Janet Yellen said she wanted “more decisive evidence” that labour markets are improving before making the final decision on interest rates.
Stock markets bounced around before and after the Fed statement and Yellen’s news conference.
The Toronto Stock Exchange’s S&P/TSX composite index slipped 20.07 points, or 0.14 percent, to close at 14,732.98.
The Dow Jones industrial average rose 31.26 points, or 0.17 percent, to 17,935.74, the S&P 500 gained 4.15 points, or 0.2 percent, to 2,100.44 and the Nasdaq Composite added 9.33 points, or 0.18 percent, to 5,064.88.
Winnipeg ICE Futures Canada dollars per tonne
Canola Jul 2015 497.00 +6.00 +1.22%
Canola Nov 2015 496.20 +6.80 +1.39%
Canola Jan 2016 492.00 +6.80 +1.40%
Canola Mar 2016 488.80 +4.90 +1.01%
Canola May 2016 485.10 +4.90 +1.02%
Milling Wheat Jul 2015 210.00 unch 0.00%
Milling Wheat Oct 2015 215.00 unch 0.00%
Milling Wheat Dec 2015 215.00 unch 0.00%
Durum Wheat Jul 2015 298.00 unch 0.00%
Durum Wheat Oct 2015 298.00 unch 0.00%
Durum Wheat Dec 2015 303.00 unch 0.00%
Barley Jul 2015 210.00 unch 0.00%
Barley Oct 2015 205.00 unch 0.00%
Barley Dec 2015 210.00 unch 0.00%
American crop prices in cents US/bushel, soybean meal in $US/short ton, soy oil in cents US/pound
Chicago
Soybeans Jul 2015 969 +11.5 +1.20%
Soybeans Aug 2015 953.75 +12 +1.27%
Soybeans Sep 2015 941.75 +11.25 +1.21%
Soybeans Nov 2015 939.75 +12.25 +1.32%
Soybeans Jan 2016 945.75 +12.25 +1.31%
Soybeans Mar 2016 948-+11.5-+1.23%
Soybean Meal Jul 2015 323.7 +2.9 +0.90%
Soybean Meal Aug 2015 315.2 +2.6 +0.83%
Soybean Meal Sep 2015 310 +2.6 +0.85%
Soybean Oil Jul 2015 32.85 -0.05 -0.15%
Soybean Oil Aug 2015 32.94 -0.03 -0.09%
Soybean Oil Sep 2015 33.02 -0.03 -0.09%
Corn Jul 2015 359.25 +5.25 +1.48%
Corn Sep 2015 365.25 +5.5 +1.53%
Corn Dec 2015 375 +5 +1.35%
Corn Mar 2016 386.25 +5.25 +1.38%
Corn May 2016 393.25 +5 +1.29%
Oats Jul 2015 255 +2.5 +0.99%
Oats Sep 2015 261.75 +1.75 +0.67%
Oats Dec 2015 267.75 +2.25 +0.85%
Oats Mar 2016 272.75 unch 0.00%
Oats May 2016 279.5 unch 0.00%
Wheat Jul 2015 491.25 +2.5 +0.51%
Wheat Sep 2015 497 +2.5 +0.51%
Wheat Dec 2015 510.75 +2.5 +0.49%
Wheat Mar 2016 524 +3 +0.58%
Wheat May 2016 532.25 +3.25 +0.61%
Minneapolis Hard Red Spring
Wheat Jul 2015 547.75 +0.25 +0.05%
Wheat Sep 2015 557.25 +0.75 +0.13%
Wheat Dec 2015 570.25 +1.5 +0.26%
Wheat Mar 2016 583.75 +2 +0.34%
Wheat May 2016 592.5 +1.75 +0.30%
Kansas City Hard Red Winter
Wheat Jul 2015 505.5 -1 -0.20%
Wheat Sep 2015 514.75 -0.75 -0.15%
Wheat Dec 2015 533.75 +0.25 +0.05%
Wheat Mar 2016 547.25 +0.25 +0.05%
Wheat May 2016 556 unch 0.00%