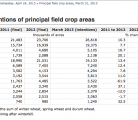
Statistics Canada’s March seeding intentions survey shows increases in spring wheat and durum wheat compared with 2012 as well as a possible decrease in canola acreage. Indications are that corn for grain and soybean areas could reach new records nationally.
Farmers may modify their plans prior to planting time as a result of environmental conditions. Some farmers reported that they were still undecided about their final strategies for 2013 as snow lingered in fields in most parts of Canada at the time of the survey.
The following is a screen capture of the Statistics Canada chart showing planting intentions: 
Table 1
March intentions of principal field crop areas
| 2011 (final) | 2012 (final) | March 2013 (intentions) | 2011 to 2012 | 2012 to March 2013 | |
|---|---|---|---|---|---|
| thousands of acres | % change | ||||
| Total wheat1 | 21,483 | 23,706 | 26,618 | 10.3 | 12.3 |
| Spring wheat | 15,734 | 16,939 | 19,375 | 7.7 | 14.4 |
| Durum wheat | 4,011 | 4,680 | 5,105 | 16.7 | 9.1 |
| Winter wheat2 | 1,739 | 2,088 | 2,138 | 20.1 | 2.4 |
| Canola | 18,990 | 21,531 | 19,133 | 13.4 | -11.1 |
| Barley | 6,589 | 7,405 | 7,240 | 12.4 | -2.2 |
| Soybeans | 3,582 | 4,153 | 4,294 | 7.8 | 3.4 |
| Corn for grain | 3,192 | 3,544 | 3,813 | 11.0 | 7.6 |
| Summerfallow | 11,763 | 4,485 | 3,522 | -61.9 | -21.5 |
| Dry field peas | 2,437 | 3,340 | 3,430 | 37.1 | 2.7 |
| Oats | 3,244 | 2,854 | 3,379 | -12.0 | 18.4 |
| Lentils | 2,558 | 2,515 | 2,063 | -1.7 | -18.0 |
| Flaxseed | 740 | 980 | 1,240 | 32.5 | 26.5 |


