WINNIPEG, Dec. 20 (MarketsFarm) – Intercontinental Exchange (ICE) Futures canola contracts finished stronger on Friday, amid light and choppy trade activity.
Earlier in the week, canola values received a boost from strong trading activity and profit-taking ahead of the holidays. However, that activity has largely tapered off.
Strong domestic crush margins have also been favourable for canola. According to ICE, crush margins for the January contract have remained over C$118 dollars for most of the week.
Weakness in the soy complex on the Chicago Board of Trade put pressure on canola values. One Winnipeg-based trader said that canola remains “cheap and well-supported” in comparison to other vegetable oils.
Read Also

Carney expects to meet senior China leaders, sidesteps question on tariffs
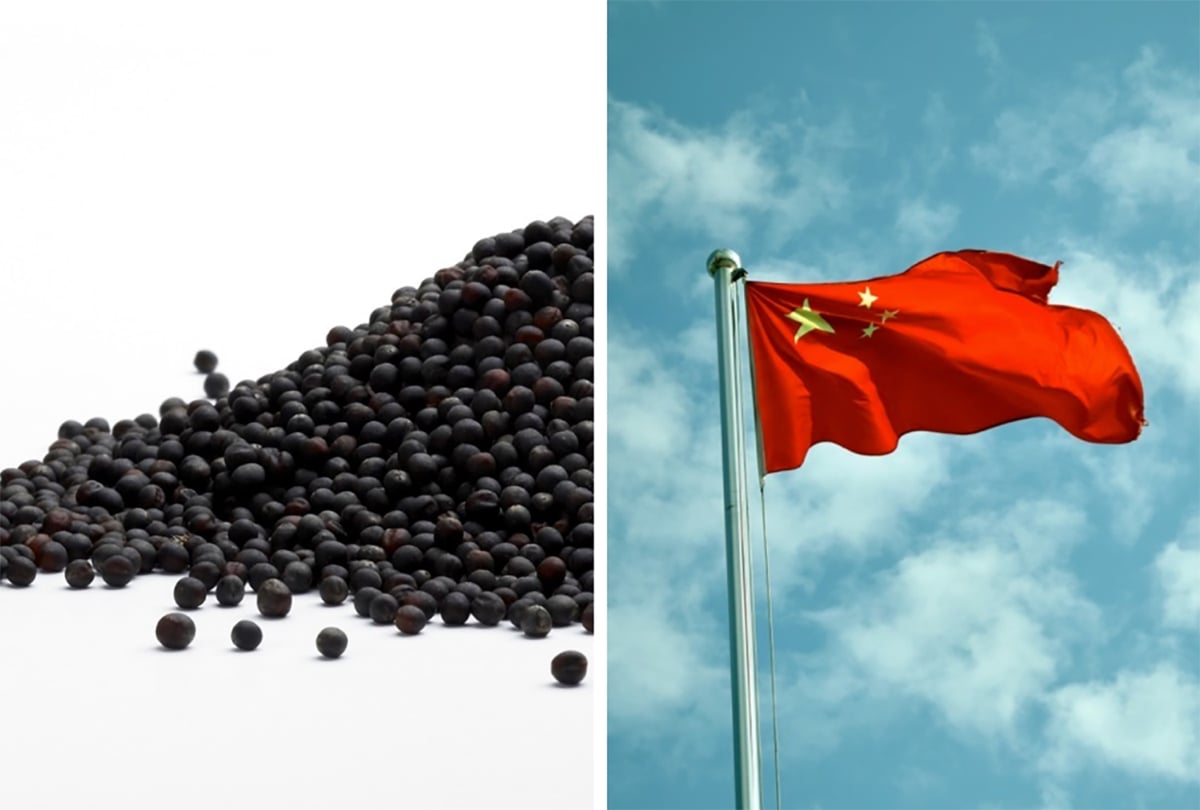
Prime Minister Mark Carney on Thursday said he expected to meet senior Chinese leaders soon but sidestepped a question about dropping tariffs on Chinese electric vehicles in exchange for relief from Beijing’s duties on canola.
The Canadian dollar held steady at just over 76 U.S. cents at midday, keeping a lid on further gains.
On Friday, 42,945 contracts were traded, which compares with Thursday when 40,772 contracts changed hands. Spreading accounted for 36,270 contracts traded.
SOYBEAN futures at the Chicago Board of Trade (CBOT) were stronger on Friday, boosted by strong export data from the United States Department of Agriculture (USDA).
According to last week’s export sales report, soybean exports were up by 36 per cent compared to the previous week, and 18 per cent above the four-week average. Soybean export sales totaled 1.43 million tonnes last week, which was higher than market expectations.
However, soyoil futures were slightly weaker on the day, in order to remain competitive with Malaysian palm oil. Palm oil exports for the first three weeks of December totaled over 873,000 tonnes, which was about 17 per cent lower than during the same period in the previous month.
Since the trade deal between the U.S. and China has not been inked yet, some market participants have speculated that China may not fulfill their pledge to purchase US$40 billion in U.S. agriculture products per year. However, JCI, a Shanghai-based consultancy has said “…as a Chinese consultant company on the agriculture market, JCI strongly believes that China has the ability and will fulfil its promise.”
The company also said the US$40 billion in purchases includes US$18.7 billion worth of U.S. soybeans, which is approximately 45 million tonnes. According to Reuters, China’s soybean imports dropped by 50 per cent to 16.6 million tonnes in 2018.
CORN futures finished slightly higher today. Last week, corn exports totaled over 1.7 million tonnes. That’s 96 per cent higher than the previous week and significantly higher than the four-week average.
JCI expects China to make corn purchases totaling US$1.8 billion, and US$1.4 million in purchases for wheat.
WHEAT futures were higher on Thursday, supported by strong export demand. Exports also hit marketing year highs, totaling over 868,000 tonnes. That’s 73 per cent higher than the previous week and 95 per cent above the four-week average.
The European Union Commission raised EU wheat export estimates to 28 million tonnes, which is 2 million tonnes higher than their November estimate.
OUTSIDE MARKETS
Light crude oil nearby futures in New York was up 18 cents at US$60.36 per barrel.
In the afternoon, the Canadian dollar was trading around US75.96 cents, down .24 cents from the previous trading day. The U.S. dollar was C$1.3164 up from $1.3119 the previous day.
ICE Futures Canada dollars per tonne.
| Name / Contract | High | Low | Last | Change | Settlement |
| Canola Jan 2020 | 468.90 | 465.50 | 467.70 | 0.80 | 467.70 |
| Canola Mar 2020 | 478.60 | 475.20 | 477.30 | 0.20 | 477.30 |
| Canola May 2020 | 487.90 | 484.50 | 487.10 | 0.80 | 487.10 |
| Canola Jul 2020 | 494.30 | 490.10 | 494.00 | 2.10 | 494.00 |
| Canola Nov 2020 | 496.80 | 492.50 | 495.20 | 2.10 | 495.20 |
| Soybean Jan 2020 | 930.00 | 924.00 | 928.25 | 3.75 | 928.00 |
| Soybean Mar 2020 | 941.00 | 935.25 | 938.25 | 2.00 | 938.00 |
| Soybean May 2020 | 954.25 | 948.75 | 951.25 | 1.25 | 951.25 |
| Soybean Jul 2020 | 965.00 | 960.50 | 962.50 | 0.50 | 962.25 |
| Soybean Aug 2020 | 968.75 | 965.00 | 966.25 | 0.25 | 966.00 |
| Soybean Sep 2020 | 966.00 | 963.00 | 963.50 | -0.25 | 963.75 |
| Soybean Meal Jan 2020 | 299.80 | 297.80 | 297.90 | -0.50 | 297.90 |
| Soybean Meal Mar 2020 | 304.00 | 302.00 | 302.20 | -0.50 | 302.20 |
| Soybean Meal May 2020 | 307.30 | 305.50 | 305.70 | -0.50 | 305.50 |
| Soybean Oil Jan 2020 | 33.99 | 33.56 | 33.79 | unch | 33.79 |
| Soybean Oil Mar 2020 | 34.27 | 33.85 | 34.06 | -0.01 | 34.06 |
| Soybean Oil May 2020 | 34.56 | 34.18 | 34.36 | -0.01 | 34.36 |
| Corn Mar 2020 | 389.50 | 386.00 | 387.75 | 1.25 | 387.75 |
| Corn May 2020 | 395.75 | 392.50 | 394.00 | 1.00 | 394.00 |
| Corn Jul 2020 | 401.50 | 398.00 | 399.50 | 0.75 | 399.75 |
| Corn Sep 2020 | 400.25 | 398.00 | 399.50 | 1.00 | 399.75 |
| Corn Dec 2020 | 402.50 | 399.75 | 401.75 | 1.25 | 402.00 |
| Oats Mar 2020 | 300.50 | 291.00 | 292.00 | -5.25 | 292.00 |
| Oats May 2020 | 294.00 | 288.25 | 288.25 | -5.25 | 288.75 |
| Oats Jul 2020 | 281.50 | 281.50 | 281.50 | -2.75 | 281.50 |
| Oats Sep 2020 | 282.00 | 271.00 | 271.00 | -1.50 | 272.50 |
| Oats Dec 2020 | 269.00 | 266.00 | 268.50 | -1.25 | 266.00 |
| Wheat Mar 2020 | 549.00 | 538.75 | 542.25 | -3.00 | 542.50 |
| Wheat May 2020 | 552.25 | 542.50 | 546.00 | -2.75 | 546.50 |
| Wheat Jul 2020 | 553.25 | 544.75 | 548.75 | -2.00 | 549.25 |
| Wheat Sep 2020 | 558.25 | 549.50 | 553.75 | -2.00 | 554.00 |
| Wheat Dec 2020 | 566.00 | 558.25 | 562.25 | -2.25 | 562.50 |
| Spring Wheat Mar 2020 | 541.50 | 532.50 | 538.25 | -3.00 | 538.25 |
| Spring Wheat May 2020 | 549.25 | 540.25 | 547.25 | -2.00 | 547.25 |
| Spring Wheat Jul 2020 | 556.25 | 549.00 | 555.50 | -1.50 | 555.50 |
| Spring Wheat Sep 2020 | 566.00 | 560.00 | 562.00 | -4.00 | 562.00 |
| Spring Wheat Dec 2020 | 579.00 | 571.50 | 575.00 | -4.00 | 575.00 |
| Hard Red Wheat Mar 2020 | 464.75 | 457.00 | 462.25 | 1.75 | 462.50 |
| Hard Red Wheat May 2020 | 472.75 | 465.75 | 470.25 | 1.50 | 470.50 |
| Hard Red Wheat Jul 2020 | 479.75 | 472.75 | 477.75 | 1.75 | 478.00 |
| Hard Red Wheat Sep 2020 | 486.25 | 480.00 | 484.50 | 1.75 | 485.00 |
| Hard Red Wheat Dec 2020 | 495.25 | 489.75 | 494.00 | 1.50 | 494.25 |
| Live Cattle (Pit) Dec 2019 | 122.23 | 122.23 | 122.23 | 0.10 | 122.23 |
| Live Cattle (Pit) Feb 2020 | 125.80 | 125.80 | 125.80 | 0.18 | 125.80 |
| Live Cattle (Pit) Apr 2020 | 126.73 | 126.73 | 126.73 | -0.03 | 126.73 |
| Feeder Cattle (Pit) Jan 2020 | 144.28 | 144.28 | 144.28 | -0.45 | 144.28 |
| Feeder Cattle (Pit) Mar 2020 | 144.38 | 144.38 | 144.38 | -0.45 | 144.38 |
| Feeder Cattle (Pit) Apr 2020 | 146.50 | 146.50 | 146.50 | -0.50 | 146.50 |
| Lean Hogs (Pit) Feb 2020 | 70.68 | 70.68 | 70.68 | -0.30 | 70.68 |
| Lean Hogs (Pit) Apr 2020 | 77.50 | 77.50 | 77.50 | unch | 77.50 |
| Lean Hogs (Pit) May 2020 | 83.70 | 83.70 | 83.70 | -0.30 | 83.70 |


