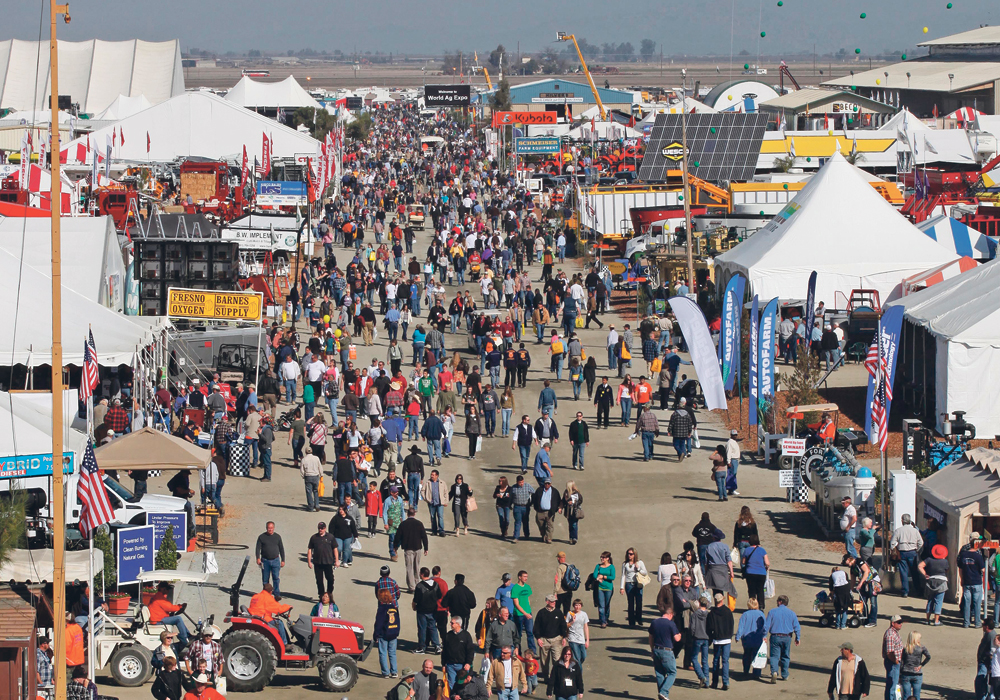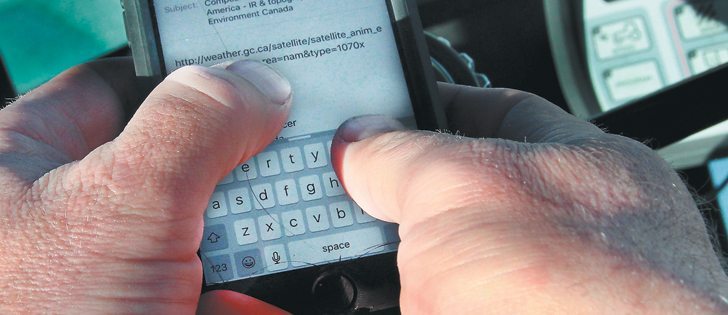

Precision farming, specifically spatial analytics, is about making decisions from the data that we can glean from a field.
No matter what the crop is, hundreds of types of data can be collected for analysis.
Yield is the biggest one. After all, it is the net result, the outcome for the year, the source of income and the whole goal of crop production. How can you not have yield data? So this column looks at obtaining yield data from some of the more interesting crops I have seen.
Read Also
House ag committee to undertake several studies
The House of Commons standing agriculture committee has set its agenda for the coming months. Members began the fall sitting with a two-hour update on international trade
Many crops have some type of issue that make collecting yield data more difficult than the grain crops with which prairie farmers are most familiar.
With grain, clean crop hits the mass flow plate in a yield monitor before going into the grain tank.
The plate is attached to a sensor, which measures the pressure of grain hitting the plate and then calibrates it to calculate weight.
Moisture levels and the speed of the clean grain elevator that is “throwing” the grain at the mass flow sensor plate are also considered when calculating bushels of yield.
This is relatively easy compared to a crop such as cotton.
I think most people would agree that cotton hitting a mass flow sensor plate to record pressure isn’t going to work. Those cotton balls just aren’t going exert much force.
Other sensors could be used, such as sonic sensors, but that doesn’t make much sense either. I don’t see cotton generating many sonic waves for the sensor.
There is always an optic sensor, similar to a garage door trip light, which would measure volume of cotton. This works, except that volume can vary depending on moisture levels and how the cotton is handed.
However, most of these issues have been worked through, and cotton yield monitors are growing in popularity.
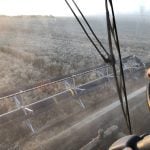
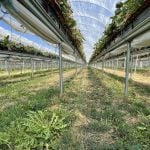
Obtaining yield data for crops from trees and vines, such as figs, apples and avocados, can be difficult, but not impossible.
A fellow instructor had an apple orchard, and he insisted that there was no sense in doing precision farming with his trees. He thought it would need to be done by the square foot, which was impossible with a tree.
I explained that GIS works with objects, and we can adjust the resolution of a project based on the object with which we are dealing. For example, trying to find a city within a state does not require a map of every square foot of that state. Our scale needs to match our object of interest.
I told him that mapping each tree, recording data about that tree and recording the number of apples from each tree would still be precision farming, and he enthusiastically replied that he already does that.
He had a pad of paper that included notes about each tree, its condition, treatments done to the tree and even the pounds of apples that he harvested from each tree.
We put that data into a spreadsheet, mapped his trees with a GPS unit, joined the spreadsheet to the tree points and we had a map showing variation of yields and patterns of treatments in his orchard.
I recognize that this was possible in a small orchard in which a group of people are doing the harvesting and can weigh product from each individual tree.
I’ve worked with small vineyards that keep track of harvest records by row sections or individual vines.
However, large orchards and vineyards are harvested by many employees or a mechanical device that gathers product and aggregates from many trees before it is weighed.
This makes it difficult to attribute the amount of product to an individual tree or vine.
There needs to be a way of doing this, not only for yield mapping, but for quality purposes to document which lot of product came from a specific tree.
Underground crops such as sugar beets, potatoes and peanuts may be harvested in a two-step process: digging up the product and then retrieving, cleaning and aggregating it for storage or processing. One problem with getting accurate yield data from these crops is that soil that comes with them.
The produce must be weighed free of soil and at a point where the weight can still be associated with its original location.
Pressure sensors in the belts that carry clean product can calculate weight, and GPS locations can include a lag time, similar to grain yield mapping systems, that account for the cleaning time after pickup. This can be difficult, but yield mapping is becoming a larger part of potato and sugar beet production.
This has hopefully been interesting, but there is an ulterior motive: reviewing the problems faced by growers of crops such as cotton and potatoes should make grain yield maps look easy in comparison.
However, I still hear agronomists and consultants complain about inconsistent yield data from growers.
Sometimes it’s a big blank area in the middle of the field because the combine operator forgot to hit a button to start recording yield data after a lunch break. Sometimes it’s an operator’s “happy fingers” that accidently turn off a setting that prevents yield data mapping. Sometimes it’s a frustrating harvest season and the grower just doesn’t want to mess with that black box.
I still hear stories about data that doesn’t get off the yield monitor. There may be files from a couple of years back stuck in there somewhere. It may be too confusing to load or unload the data files onto that small little disk. It may have gotten lost. It may have been accidently deleted.
For whatever reason, we all need to do a better job of accessing yield data and making sure it’s complete. This is the data that shows where you made money. It can show you what production practices worked and what didn’t. It needs to be part of the whole analysis.
If a fig grower can figure out how to make a yield map, we grain growers should be able to make one, too.
Terry A. Brase is an educational consultant, former precision agriculture educator and author. BrASE LLC. Contact him at precision.happens@producer.com