Market analysts like to say that commodity prices were “volatile” over the last week, last month or last year.
As well, legislators have conducted investigations to determine the factors behind extreme volatility in wheat, corn and oilseed markets.
However, there isn’t a measuring stick to define “volatility” in grain and oilseed prices, which is partially why the International Food Policy Research Institute (IFPRI) launched its excessive food price variability early warning system in early July.
“There is no measure of what that (volatility) means,” said Maximo Torero, director of markets, trade and institutions at IFPRI, a think-tank in Washington, D.C., that seeks solutions to global hunger and poverty.
Read Also
Alberta harvest wrapping up: report
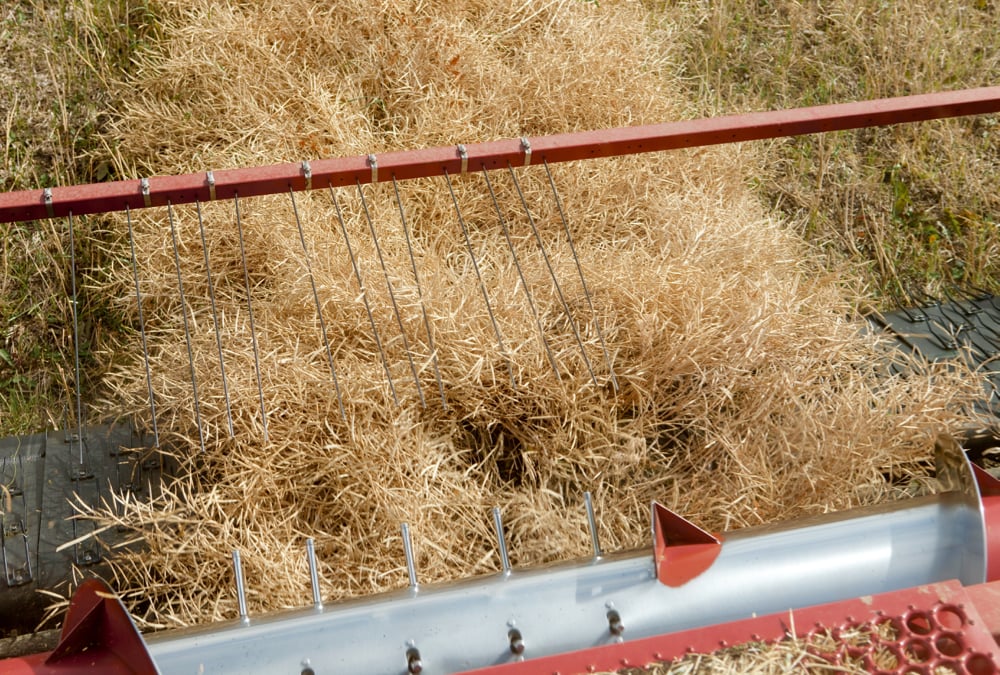
Harvest operations advanced to 96 per cent complete in Alberta as of Oct. 7, with only a few late-seeded cereal and canola fields remaining, according to the latest provincial crop report.
The primary purpose of the price variability tool is to alert politicians, humanitarian organizations and farmers that food prices are entering a period of excessive volatility.
“Excessive is very important. Why? Because those are the periods where both farmers and consumers will lose. Farmers, because they don’t know what will be the return on their investment,” said Torero.
“This tool will help to reduce inconsistent information on price variability on the global level by providing timely and transparent market information.”
He said the program’s computer model is based on the futures prices of four commodities: hard wheat, soft wheat, soybeans and corn on the Chicago Mercantile Exchange and Kansas City Board of Trade.
The model compares price movements, or return on investment on a particular day, compared to expected movements based on a historical record of futures prices dating back to the 1950s.
Torero said a return on investment, which should occur only five percent of the time, is an indicator of volatility.
Torero said the futures markets’ reaction to Russia’s ban on wheat exports last August was an example of an excessive price move.
“Immediately, there was a substantial increase in the return on prices … and that jump, in our model, is what we identify as an abnormality. It went over the 95th percentile.”
The model then counts how often returns are excessive to determine if prices are volatile or not for a particular commodity.
The IFPRI model, when used on the Russian export ban example, shows that wheat prices remained excessively volatile from early August until the middle of October 2010.
Carlos Martins Filho, senior research fellow with IFPRI, said this measure of volatility should help policy makers react to market conditions.
“With better and more precise information, they can devise policies to mitigate the impacts of volatility on both producers and consumers, particularly the poorest consumers in developing countries.”
Farmers can also use the information to decide to plant a particular crop and when to sell that crop, Torero said.
“For example, if I’m a producer and I see that there are several (incidents that indicate) a period of extreme volatility in a specific commodity, I would be a little bit worried because I don’t know if I can realize my return (on investment).”
He said the early warning system won’t curb rising food prices and won’t be a make or break factor for most farmers, but it is another tool in the kit.
“It’s additional information… to make more informed decisions.”
For more information, visit www.foodsecurityportal.org.


