Canola traded in a very narrow band Wednesday and settled down a little, pressured by a strong loonie and good supplies after harvest. Crop futures were generally lower.
November canola fell to $465.40 per tonne, down $1.50.
Most-active January closed at $474.50, down $1.70 per tonne
U.S. soybean futures dropped to their lowest levels in nearly three weeks on expectations for rains to benefit plantings in Brazil, the world’s top exporter, Reuters reported.
Concerns about slowing demand from China, the world’s top importer, added pressure to prices.
Rain showers in Brazil will help farmers advance seeding. Some had been holding back waiting for rain. The crop is expected to reach a record 100 million tonnes.
Read Also
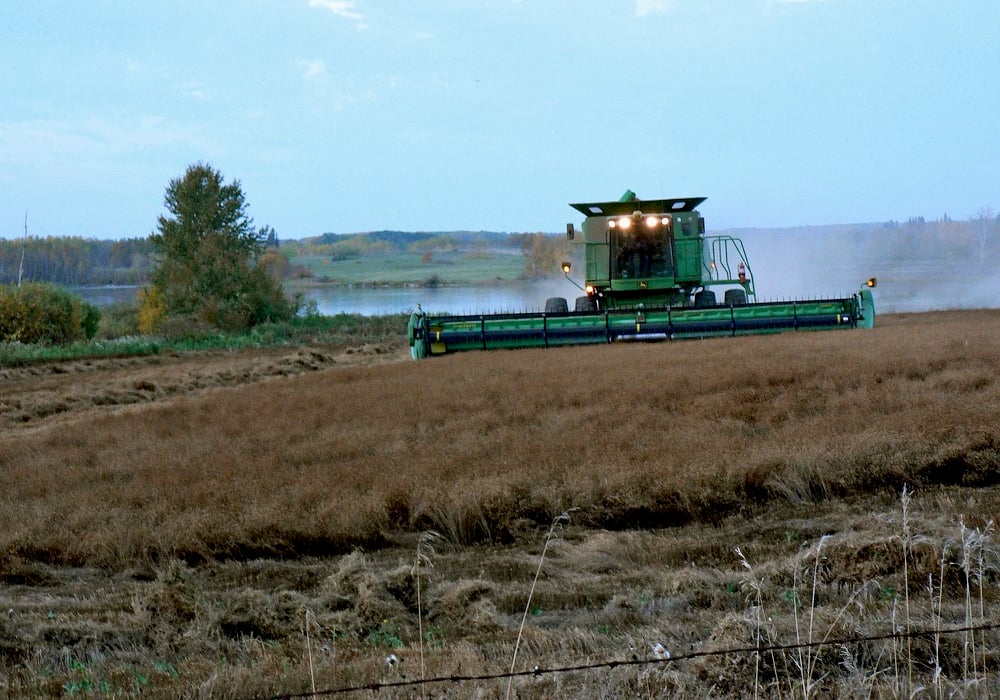
Most of Manitoba harvest wraps up for 2025
Manitoba Agriculture issued its final crop report of 2025, showing the overall provincewide harvest at 97 per cent complete as of Oct. 20. Nearly all major crops have finished combining, with 37 per cent of Manitoba’s sunflowers finished, plus 71 per cent of grain corn and small amounts of soybeans and potatoes left to do.
Worries that China could slow imports of dried distillers grains, a byproduct of corn-based ethanol, further pressured futures. Chinese customers stopped buying U.S. DDGS on fears that Beijing may launch another anti-dumping probe into the imports, industry sources said.
>>>More market news: Monsanto thinks corn prices will rebound as demand increases
U.S. wheat futures sagged, weighed down by forecasts for more rain in the southern Plains that improved conditions for development of the recently seeded hard red winter wheat. There was rain today that would be beneficial for soft red winter wheat crops in the Midwest.
Declines were kept in check by a round of short-covering as traders scrambled to cover bearish bets when prices hit session lows.
Light crude oil nearby futures in New York rose $2.74 to US$45.94 per barrel, its best gain in about three months. The rise in U.S. weekly crude supplies was less than expected, Gasoline supplies fell.
The U.S. Federal Reserve wrapped up its monthly two-day meeting and did not raise interest rates but said a December increase was still possible because of gathering strength in the U.S. economy.
The Toronto Stock Exchange’s S&P/TSX composite index closed up 163.56 points, or 1.19 percent, at 13,863.16.
The Dow Jones industrial average rose 198.09 points, or 1.13 percent, to 17,779.52, the S&P 500 gained 24.46 points, or 1.18 percent, to 2,090.35, its highest in more than two months. The Nasdaq Composite added 65.55 points, or 1.3 percent, to 5,095.69.
>>>Get news and markets updates every morning. Sign up four our email newsletter>>>
ICE Futures Canada, C$ per tonne
Canola Nov 2015 465.40 -1.50 -0.32%
Canola Jan 2016 474.50 -1.70 -0.36%
Canola Mar 2016 480.40 -1.70 -0.35%
Canola May 2016 483.10 -2.00 -0.41%
Canola Jul 2016 483.10 -2.00 -0.41%
Milling Wheat Dec 2015 233.00 unch 0.00%
Milling Wheat Mar 2016 238.00 -1.00 -0.42%
Milling Wheat May 2016 242.00 -1.00 -0.41%
Durum Wheat Dec 2015 330.00 unch 0.00%
Durum Wheat Mar 2016 335.00 unch 0.00%
Durum Wheat May 2016 340.00 unch 0.00%
Barley Dec 2015 185.00 unch 0.00%
Barley Mar 2016 187.00 unch 0.00%
Barley May 2016 188.00 unch 0.00%
American crop prices in cents US/bushel, soybean meal in $US/short ton, soy oil in cents US/pound
Chicago
Soybeans Jan 2016 882.75 -8.25 -0.93%
Soybeans Mar 2016 886.5 -7 -0.78%
Soybeans May 2016 891.75 -6 -0.67%
Soybeans Jul 2016 897.25 -5.75 -0.64%
Soybeans Aug 2016 895.75 -5.5 -0.61%
Soybean Meal Dec 2015 299.9 -4.8 -1.58%
Soybean Meal Jan 2016 299.6 -4.6 -1.51%
Soybean Meal Mar 2016 298.6 -4.3 -1.42%
Soybean Oil Dec 2015 28.11 +0.22 +0.79%
Soybean Oil Jan 2016 28.42 +0.21 +0.74%
Soybean Oil Mar 2016 28.67 +0.22 +0.77%
Corn Dec 2015 376 -4 -1.05%
Corn Mar 2016 386 -3.75 -0.96%
Corn May 2016 392.25 -3.75 -0.95%
Corn Jul 2016 396.5 -4.25 -1.06%
Corn Sep 2016 396 -3 -0.75%
Oats Dec 2015 227 -0.25 -0.11%
Oats Mar 2016 230 -0.5 -0.22%
Oats May 2016 232 -0.5 -0.22%
Oats Jul 2016 236.5 -0.5 -0.21%
Oats Sep 2016 237.75 -0.5 -0.21%
Wheat Dec 2015 506 -3.25 -0.64%
Wheat Mar 2016 511.75 -2.5 -0.49%
Wheat May 2016 516.5 -2.25 -0.43%
Wheat Jul 2016 518.75 -1.75 -0.34%
Wheat Sep 2016 527.25 -1.25 -0.24%
Minneapolis
Spring Wheat Mar 2016 529 -0.75 -0.14%
Spring Wheat May 2016 539.5 -0.75 -0.14%
Spring Wheat Jul 2016 550 -0.75 -0.14%
Spring Wheat Sep 2016 561.5 -0.75 -0.13%
Kansas
Hard Red Wheat Dec 2015 485.5 -2.5 -0.51%
Hard Red Wheat Mar 2016 501.25 -2.25 -0.45%
Hard Red Wheat May 2016 511 -2.5 -0.49%
Hard Red Wheat Jul 2016 521 -2.5 -0.48%
Hard Red Wheat Sep 2016 534.75 -2.25 -0.42%