The other day after giving a presentation at a market outlook conference in Vermilion, Alberta I was wondering if my approach of looking at market history and long term market price patterns resonated with farmers. It’s always hard to tell what a crowd is thinking about what you’re saying, and I realize my approach to market outlooks is radically different than most folks’. Usually history doesn’t play much role in market outlooks and certain analysts truly believe every year is a blank slate upon which present numbers can be chalked out and fresh calculations made using traditional equations. They think market history is hogwash used to fill up the “I don’t have a clue” space when dealing with where things are going from here. In other words, if you’re trying to avoid looking into the future, go hide in the past.
Read Also
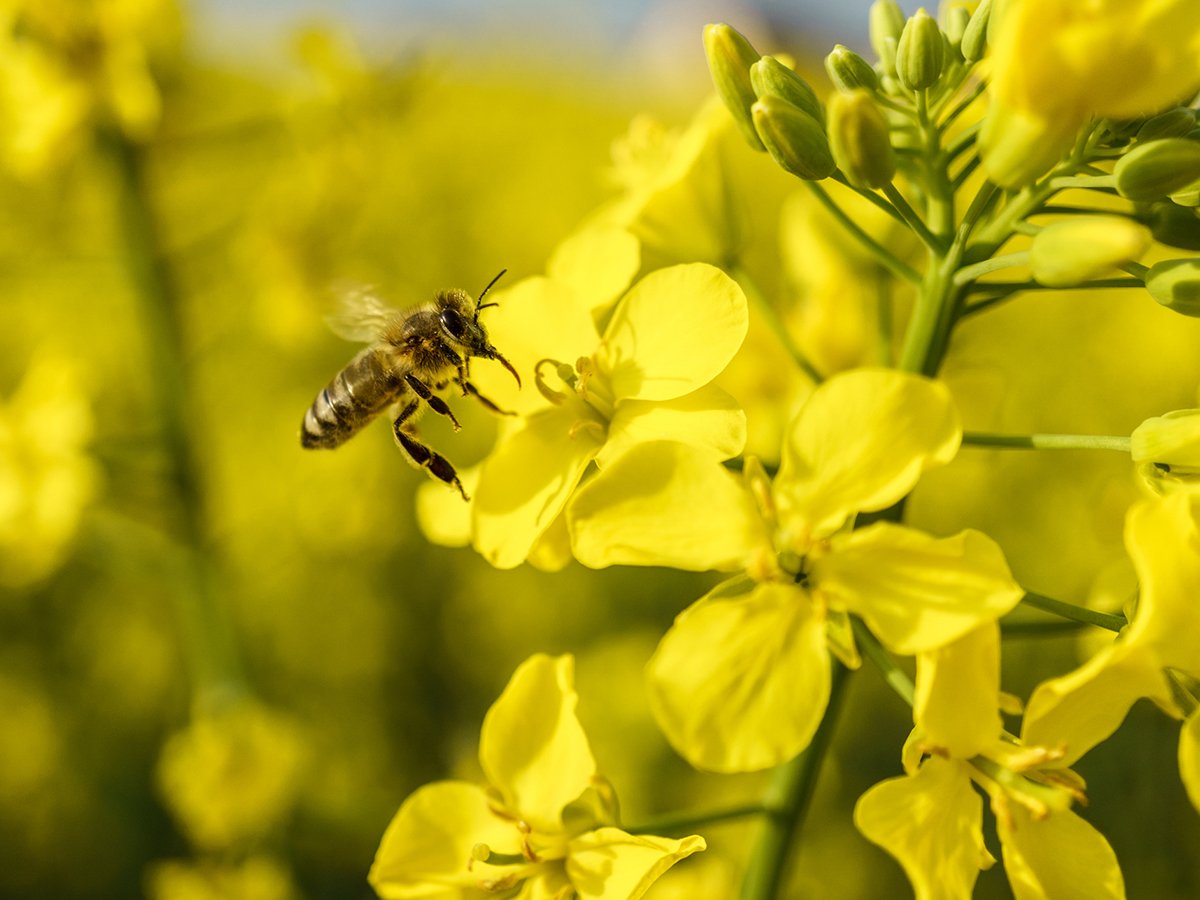
Invigor Gold variety viewed as threat to condiment mustard
Invigor Gold, the canola-quality mustard developed by BASF, is on a collision course with Canada’s condiment mustard industry. It’s difficult to see how the two can co-exist.
I was glad in Vermilion, as I was in Unity, Sask., the day before, to talk to a few farmers afterwards who seemed to have the same interest in market history and shared my belief in its relevance. I’m sure some folks in each audience last week wondered what possible relevance looking back at the price spikes of 1996, 1988, the 1972-82 era and the slump of 1929-37 had to do with the price of canola in Llodyminster in November 2009. But I was happy to meet the ones who believe that markets work in cycles and patterns and if you can figure out something about the pattern you’re living within you can get some sense of the likely future.
A particularly interesting farmer I spoke to was a woman who told me she and her husband in the flat and low price period after 1988 were wondering whether or not it was worth investing their money, time and lives in farming if it was going to be this endless, profitless grind. A professor of statistics at the University of Alberta told her that according to long term price charts he had, ones that went back centuries, not just a couple of decades, farmers should be enjoying a price rebound in 1996, so hang on to that farming dream for a couple more years and things would get better. He was right, of course, in terms of general ag commodity prices and that allowed these farmers to make it through lean years. It also allowed them to understand the cyclical nature of ag commodity prices and farm in a way that would let them gain ground during the few good years and not lose ground during the low price periods.
There are always reasons why spikes occur that appear to have nothing to do with long term cycles. 1988 had terrible weather problems that prompted that rally. So too did the mid-1990s rally. And the early 2000s rally in Western Canada. And the 1972-82 ag commodity boom period witnessed a number of weather problems and was sparked by a weather situation in Russia that caused the Soviet Union to go shopping on the world market. So perhaps every year is a blank slate upon which the weather writes its wild tale.
But what strikes me is how regularly spaced (within reason) those rallies were after 1982: always six to eight years. (1982-1988, 1988-1996, 1996-2002, 2002-2008). The pattern was remarkably different in the 1972-82 era, with repeated rallies about two years apart. And in the decades before that golden era of prices was an aeon of flat, low prices. So, what may appear to be patternless and just the product of chance to some – how can there be predictable patterns when there are three different apparent patterns in those three different periods? – seems to me like something that can be understood and used intelligently. What pattern are we living within now?
A belief that the long term pattern of ag commodities would produce a price rally in a few years helped keep the woman I spoke to in Vermilion in farming, so even if we believers in market patterns are deluded, at least it’s a faith-based approach that keeps us from despairing when times get tough. And if there’s actually something to it, all the better. I’m planning to hunt down this statistics professor, wherever retired statisticians flee to, and talk to him about his views and maybe convince him to show me his charts. Perhaps, there on paper, will be revealed the route the El Dorado, the path to Shambhala and communion with Truth. Or perhaps they’ll just be meaningless squiggles on paper.