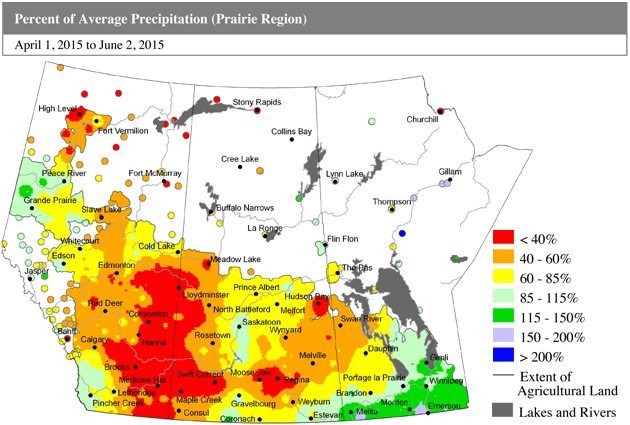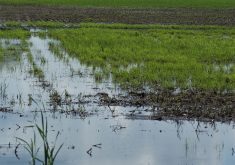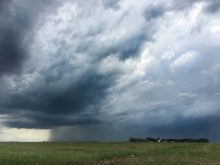
Rainfall since April 1 has been well below normal for much of Saskatchewan and Alberta.
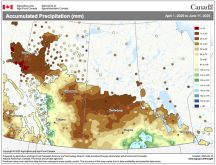
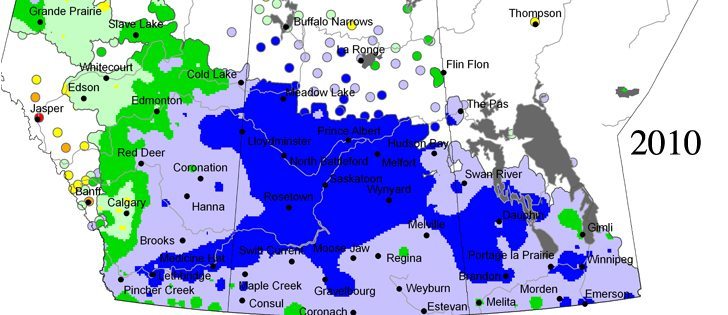
These precipitation maps show percent of normal precipitation received from April 1 to early June for the years 2010 through 2015 inclusive.
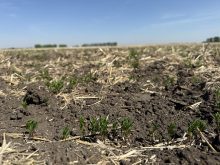
Without rain in the next week or so, yield potential could be reduced over a large part western Saskatchewan and eastern Alberta.
– Maps courtesy Agriculture & Agri-Food Canada