ROCHESTER, Minn., Aug 20 (Reuters) – “Boots on the ground” is often the best method of gauging crop potential, especially in a year like 2021 when weather has been very hit-or-miss, and this year’s Crop Tour mostly helped me confirm some of my suspicions about U.S. corn and soybeans.
This past week, I specifically wanted to see if Iowa corn looks better than the government suggested, whether southern Minnesota can pull up the state average yields, and if the eastern belt truly has record potential.
I was a scout on the Pro Farmer Midwest Crop Tour through the main U.S. corn and soybean states. This was my eighth time on the western leg of the Tour that travels through South Dakota, Nebraska, western Iowa and Minnesota. The eastern leg surveys Ohio, Indiana, Illinois and eastern and central Iowa.
Read Also
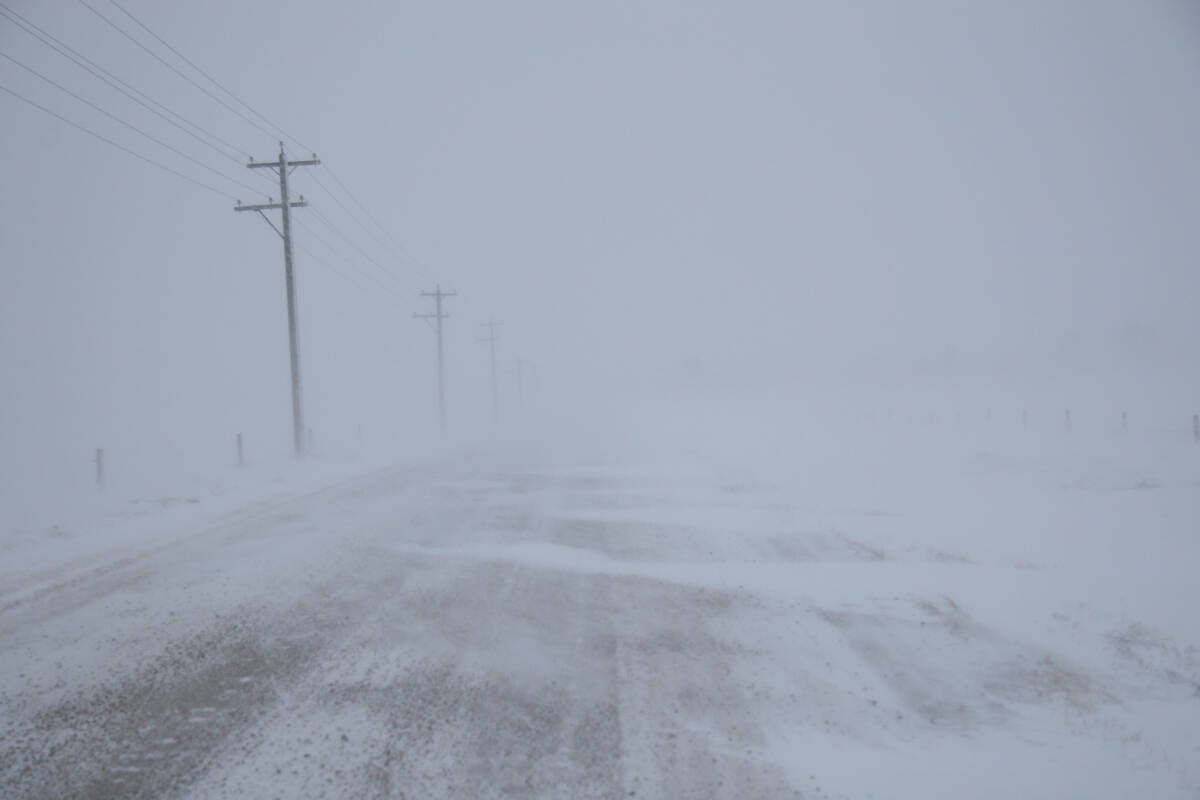
Volatile temperatures expected for this winter
DTN is forecasting a lot of temperature variability in the Canadian Prairies this winter. Precipitation should be close to average.
This was the 29th annual Tour, a long-running event held in the third week of August that is hosted in partnership with Farm Journal, the parent company of Pro Farmer. The Tour counts the number of soybean pods in a three-by-three-foot square to evaluate yield potential, and it also comes up with a rough corn yield for each field measured in bushels per acre.
Crop tour yields and pod counts are best compared against those from previous tours, because there are sampling biases in certain states based on the parts of the state that the routes cover.
IOWA
The U.S. Department of Agriculture on Aug. 12 estimated top corn grower Iowa’s corn yield at 193 bushels per acre, which aside from last year’s drought- and storm-stricken result would be the lowest state yield since 2015. Between 2016 and 2019 the state averaged about 200 bpa.
Iowa has fought with dryness since the beginning of the growing season, though many areas have received timely rains, so I thought USDA’s yield number might be a little higher. Tour data seems to support this.
With 481 samples across the state, the Tour pegged Iowa corn yield at 190.8 bpa, more than 4% above the three-year average. That is the highest Tour yield for Iowa in at least seven years, if not ever.
In 2016, Iowa’s record-yielding corn year, the Tour found 188.2 bpa in the state, though that summer was record-wet across the Midwest in July and August. The tour found that same yield in 2018.
Iowa’s record soybean yield was also in 2016, and the Tour that year found fractionally more pods than this year. The wet August of 2016 was undoubtedly a factor in the final result, and USDA has Iowa bean yield at 58 bpa, down 2 bpa from 2016.
MINNESOTA
In the No. 4 corn state Minnesota, the Tour samples only the production-heavy southern tier, though there is a sizable amount of crops grown in the northwest where drought has been prominent this year. USDA put Minnesota corn yield at 166 bpa versus last year’s near-record 192, down 14%.
That was likely weighed down by the northwestern crops, though it was unclear how much the south was a factor. The Tour found Minnesota corn yield at 177.4 bpa, down 9% from last year and off 2% from the three-year average.
The fact that southern Minnesota was well off last year’s result worries me that final state yield might end up being even lower because there were enough problems in the south. On my route, crops looked good in the southwest despite some dryness, but results were more mixed heading to the south central portion.
Pod counts in Minnesota were below last year’s tour and the three-year average, though not substantially. However, some of the recent dryness may have clipped even more potential, and the Tour may not pick up on that because it does not measure the fullness of seeds or the number of seeds per pod.
EAST
Although I did not personally assess the eastern states, the Tour numbers seemed to confirm that crops there will help pull up the national corn average, as indicated by USDA. The agency this month called for record corn and soybean yields in Illinois, Indiana and Ohio.
I believe the Tour’s corn yields in those states were the highest ever measured, or close. Illinois came in at 196.3 bpa, up 3.6% on the year, Indiana was up 7.6% at 193.5 bpa and Ohio computed to 185.1 bpa, up 10.4% from last year.
Indiana corn potential was particularly high because the Tour measured 182.3 bpa there in 2018, when the state hit its record. In Illinois’ record year, also 2018, the Tour pegged the corn at 192.6 bpa.
However, there have been some dry pockets in both Indiana and Ohio over the last month that have likely trimmed some potential, so the weather has been and will continue to be a big factor to determine if the huge expectations can be met.
There might be an issue with USDA’s record soybean expectations for the eastern states based on the Tour. Indiana was the big standout where pod counts were actually down 3.2% on the year. USDA has Indiana up 3.4% over last year.
Illinois soybean yield is set to rise 8.5%, though the Tour’s pod counts were up 3.6% from last year. Tour gains were also lighter in Ohio than what USDA suggests. Rain in the next couple of weeks could make a difference for this crop, so a final assessment is a bit more difficult right now.