After trading as high as $6.93 a bushel, the Minneapolis September spring wheat contract closed at $6.86, up 17 ¼ cents or almost 2.6 percent on the day.
Spring wheat rose after the USDA on Monday lowered the good to excellent rating of the crop to 40 percent.
That was down from 41 percent the week before and below traders’ expectations for 41 percent.
Canola, soybeans and corn all rose, but more modestly, on the U.S. crop conditions.
The USDA rated 67 percent of the U.S. corn crop in good to excellent condition, unchanged from last week but below analysts’ expectations of 68 percent.
Read Also
Manitoba extends Crown land rent freeze
Manitoba government links the continued rental rate freeze on grazing and forage leases to economic and environmental challenges facing the industry
Soybeans were rated 66 percent good to excellent, down from 67 percent a week ago and surprising analysts who expected an improvement.
Also supporting U.S. prices was a weaker U.S. buck, which fell against the euro and other currencies when the European central bank said it might start to scale back its stimulus policies.
The weaker buck caused the loonie to rally near 76 cents, limiting the gains in canola.
WEATHER IMPACTS ON CROPS
This week’s Manitoba crop report said spraying and other field activities have been delayed by regular rain. More rain is in the forecast for the eastern Prairies over the next seven days with accumulations of more than an inch.
The western Prairies are expected to have only light accumulations of rain. Areas south of the TransCanada Highway from about Moose Jaw and west are getting very dry. Areas between Saskatoon and Moose Jaw are also quite dry.
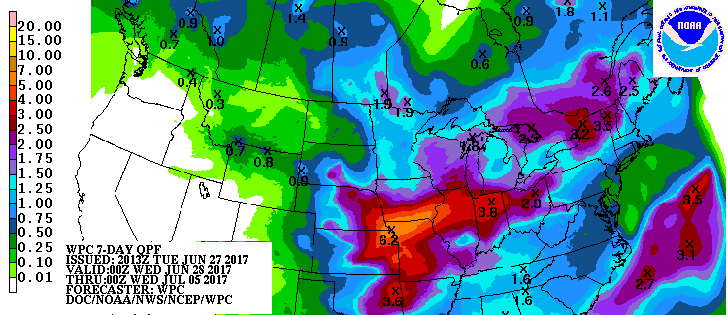
• Crops in North and South Dakota and Montana are suffering drought stress. There is little moisture in the forecast and by July 4 temperatures in that region are expected to be in the mid 30s C.
• Large rain accumulations are expected over the next seven days in the much of the U.S. Midwest with southeastern Iowa getting as much as six inches.
• European analysts are trying to figure out the damage from last week’s heat wave in the western part of the continent. Some believe it took a toll while others believe the crop maturity was far enough along that it meant little.
Crop forecasters have slightly trimmed their production expectations, but the crop is still expected to be better than last year when cool and cloudy weather lowered yields.
• The drought area of Western Australia got some rain in the past week but for most areas the accumulation was not enough to make a significant improvement to crops.
The region is expected to be mostly dry for the rest of this week.
OUTSIDE MARKETS
Light crude oil nearby futures in New York were up 86 cents US$44.24 per barrel.
In the afternoon, the Canadian dollar was trading around US75.94 cents, up from 75.49 cents the previous trading day. The U.S. dollar was C$1.3168.
The Toronto Stock Exchange’s S&P/TSX composite index fell 34.80 points, or 0.23 percent, to close at 15,281.22.
A delay in the U.S. health care bill vote in the Senate raised questions about the Republicans’ ability to move on the Trump agenda of cutting taxes and regulations.
The Dow Jones Industrial Average fell 98.89 points, or 0.46 percent, to 21,310.66, the S&P 500 lost 19.69 points, or 0.81 percent, to 2,419.38 and the Nasdaq Composite dropped 100.53 points, or 1.61 percent, to 6,146.62.
Winnipeg ICE Futures Canada dollars per tonne
Canola Jul 2017 512.70 +4.40 +0.87%
Canola Nov 2017 478.10 +4.00 +0.84%
Canola Jan 2018 483.90 +4.00 +0.83%
Canola Mar 2018 489.50 +4.00 +0.82%
Canola May 2018 493.20 unch 0.00%
Milling Wheat Jul 2017 286.00 +7.00 +2.51%
Milling Wheat Oct 2017 278.00 +6.00 +2.21%
Milling Wheat Dec 2017 281.00 +6.00 +2.18%
Durum Wheat Jul 2017 277.00 unch 0.00%
Durum Wheat Oct 2017 267.00 unch 0.00%
Barley Jul 2017 138.00 unch 0.00%
Barley Oct 2017 140.00 unch 0.00%
Barley Dec 2017 140.00 unch 0.00%
Soybeans Jul 2017 911.25 +4.50 +0.50%
Soybeans Aug 2017 916.00 +4.75 +0.52%
Soybeans Sep 2017 917.25 +4.75 +0.52%
Soybeans Nov 2017 917.50 +3.75 +0.41%
Soybeans Jan 2018 925.25 +3.50 +0.38%
Soybeans Mar 2018 932.00 +3.50 +0.38%
Soybean Meal Jul 2017 294.00 -0.10 -0.03%
Soybean Meal Aug 2017 295.80 -0.20 -0.07%
Soybean Meal Sep 2017 296.70 -0.10 -0.03%
Soybean Oil Jul 2017 32.08 +0.56 +1.78%
Soybean Oil Aug 2017 32.20 +0.55 +1.74%
Corn Jul 2017 359.25 +0.25 +0.07%
Corn Sep 2017 367.75 +0.50 +0.14%
Corn Dec 2017 377.50 +0.50 +0.13%
Corn Mar 2018 387.50 +0.50 +0.13%
Corn May 2018 393.25 +0.25 +0.06%
Oats Jul 2017 246.50 -3.25 -1.30%
Oats Sep 2017 249.00 -2.25 -0.90%
Oats Dec 2017 253.75 -3.00 -1.17%
Oats Mar 2018 256.50 -1.50 -0.58%
Oats May 2018 256.25 -1.75 -0.68%
Wheat Jul 2017 453.25 +3.25 +0.72%
Wheat Sep 2017 469.00 +3.50 +0.75%
Wheat Dec 2017 491.25 +3.25 +0.67%
Wheat May 2018 517.75 +2.00 +0.39%
Spring Wheat Jul 2017 681.50 +17.75 +2.67%
Spring Wheat Sep 2017 686.00 +17.25 +2.58%
Spring Wheat Dec 2017 680.75 +14.25 +2.14%
Spring Wheat Mar 2018 675.75 +13.25 +2.00%
Spring Wheat May 2018 669.25 +11.75 +1.79%
Hard Red Wheat Jul 2017 457.25 +4.25 +0.94%
Hard Red Wheat Sep 2017 475.75 +4.25 +0.90%
Hard Red Wheat Dec 2017 501.50 +4.25 +0.85%
Hard Red Wheat Mar 2018 515.50 +3.75 +0.73%
Hard Red Wheat May 2018 524.00 +3.25 +0.62%
Live Cattle (P) Jun 2017 119.60 -1.88 -1.55%
Live Cattle (P) Aug 2017 115.02 -3.26 -2.76%
Live Cattle (P) Oct 2017 112.78 -2.50 -2.17%
Feeder Cattle (P) Aug 2017 144.88 -4.57 -3.06%
Feeder Cattle (P) Sep 2017 144.52 -4.38 -2.94%
Feeder Cattle (P) Oct 2017 142.98 -4.22 -2.87%
Lean Hogs (P) Jul 2017 86.48 -0.55 -0.63%
Lean Hogs (P) Aug 2017 78.55 -0.13 -0.17%
Lean Hogs (P) Oct 2017 67.65 -0.72 -1.05%